Generated: 2026-07-05 08:26 UTC | 5-Day Consensus Signals with Market Indicators
| Ticker | Shares | Avg Cost | Current | Cost | Value | P&L $ | P&L % | Entry Date |
|---|---|---|---|---|---|---|---|---|
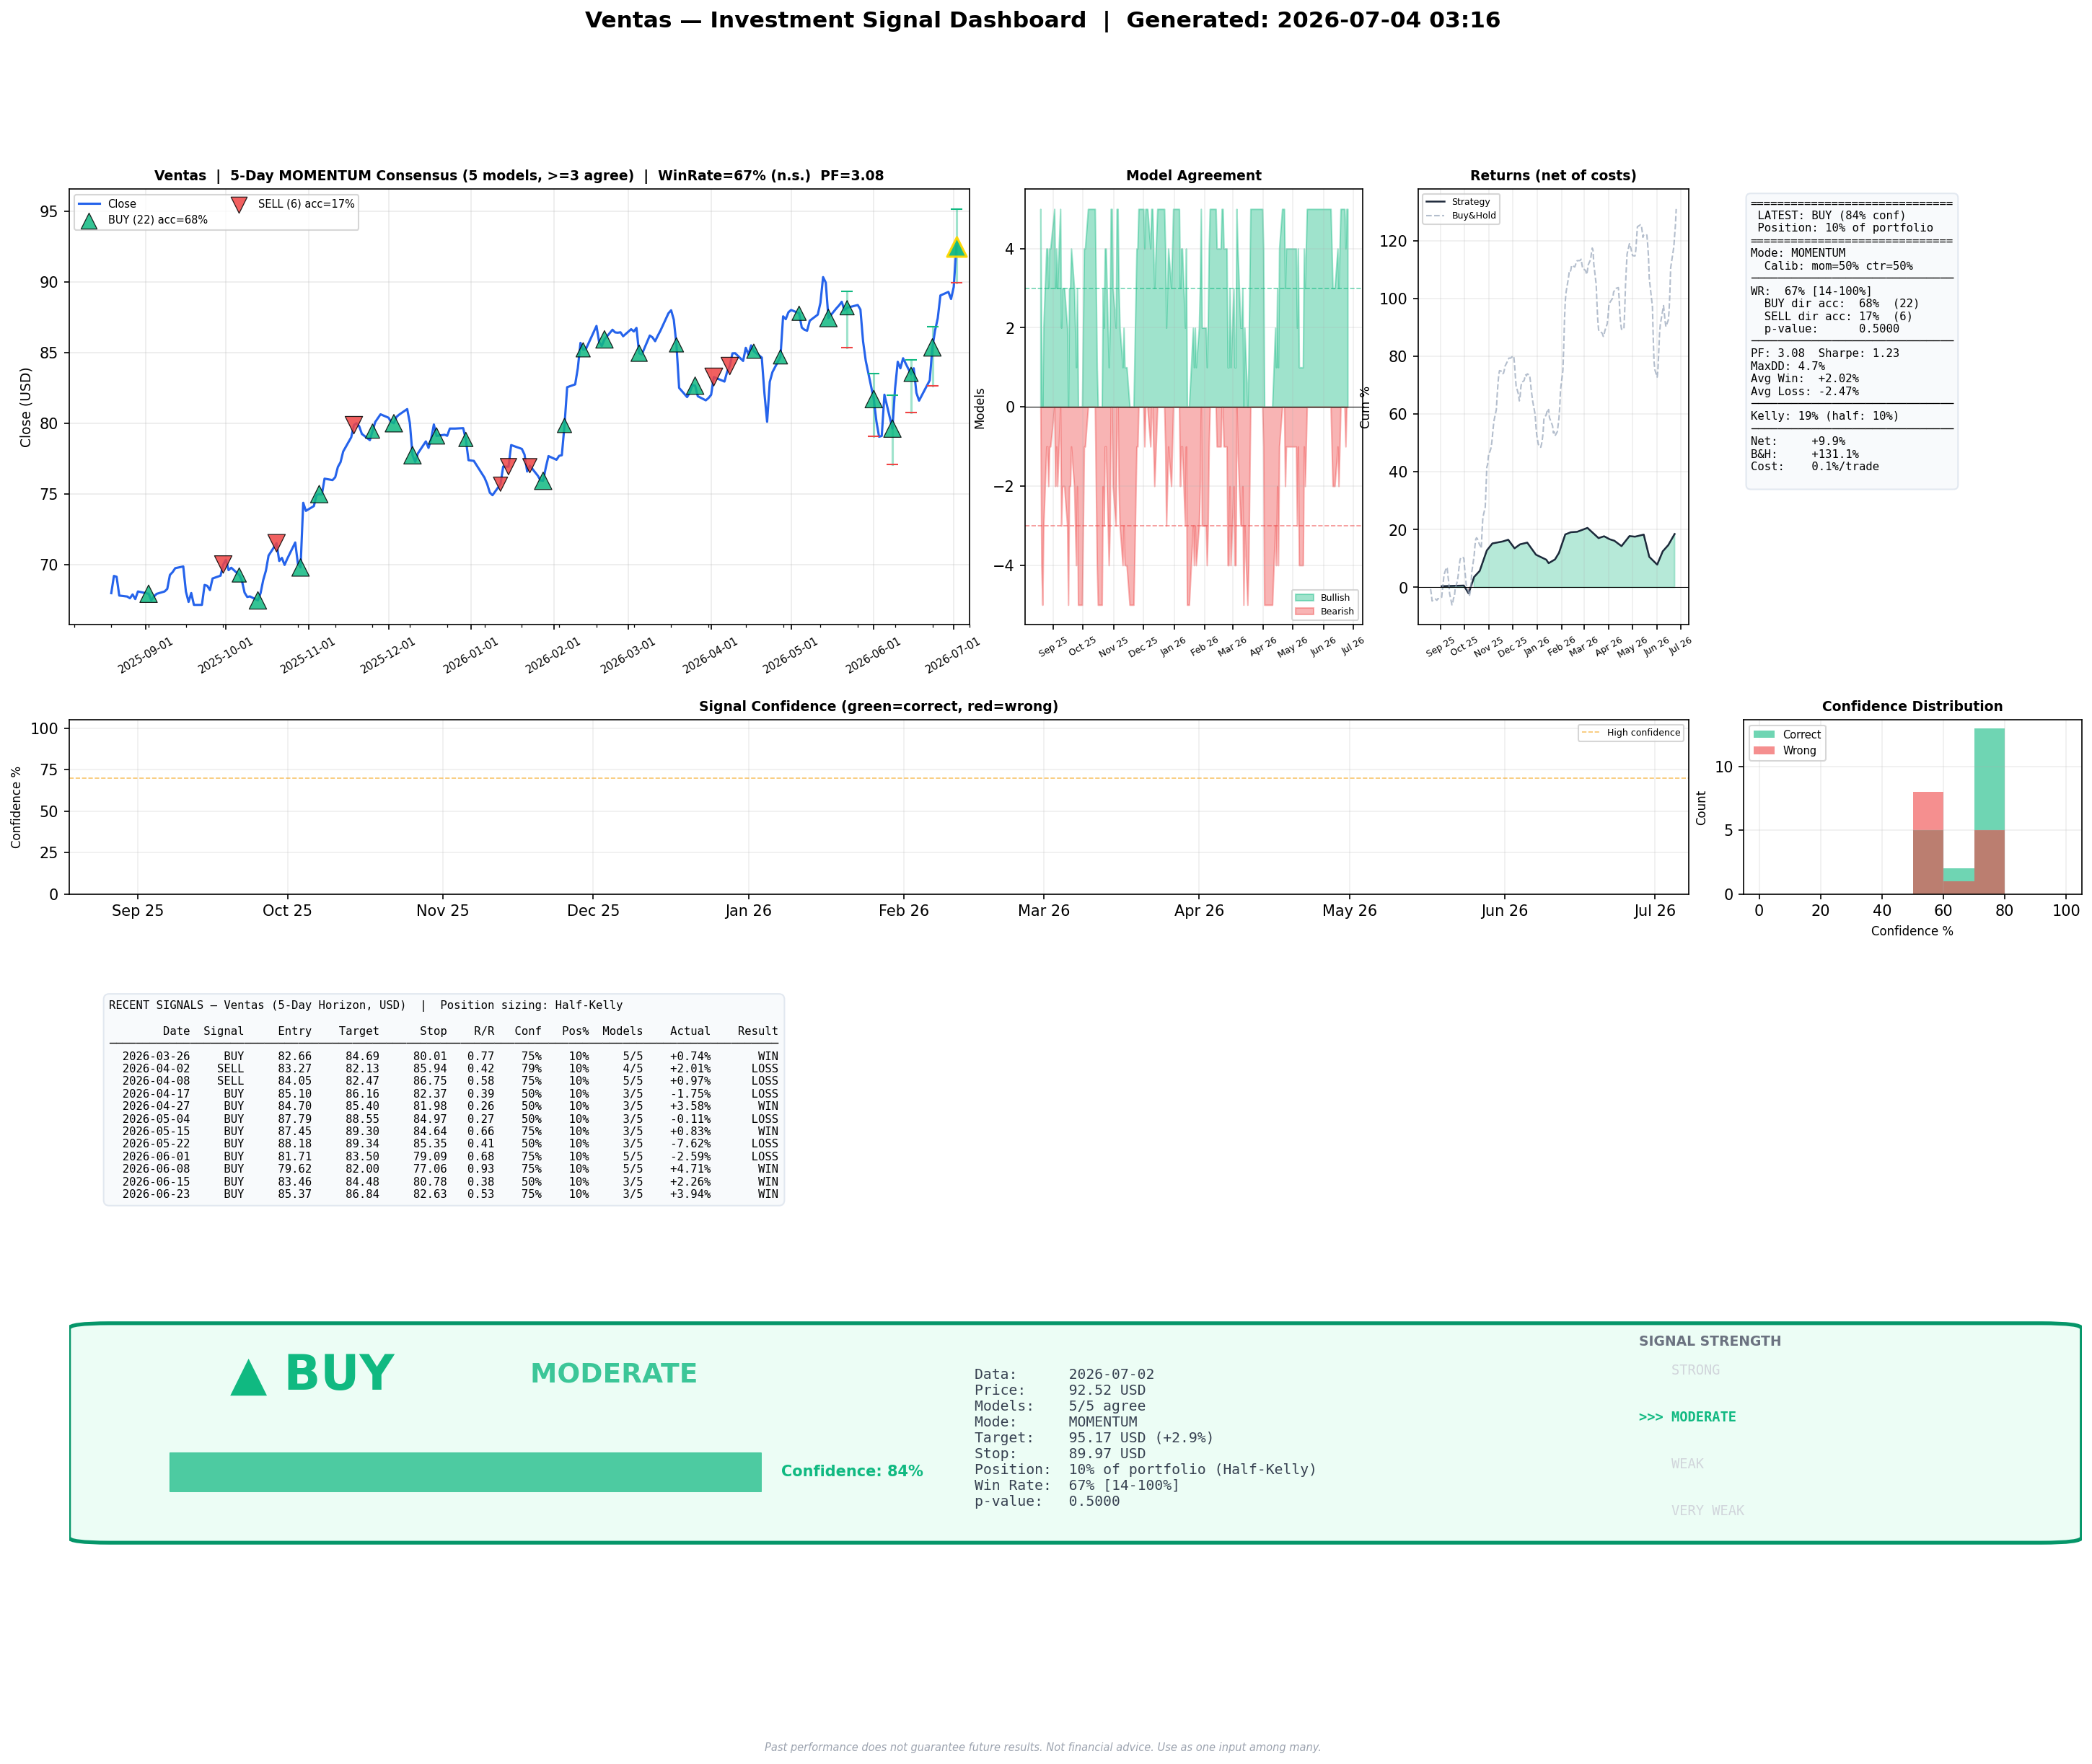
| VTR | 1407.58 | $87.52 | $92.52 | $123,197 | $130,229 | $7,032 | 5.7% | 2026-06-25 04:25 |
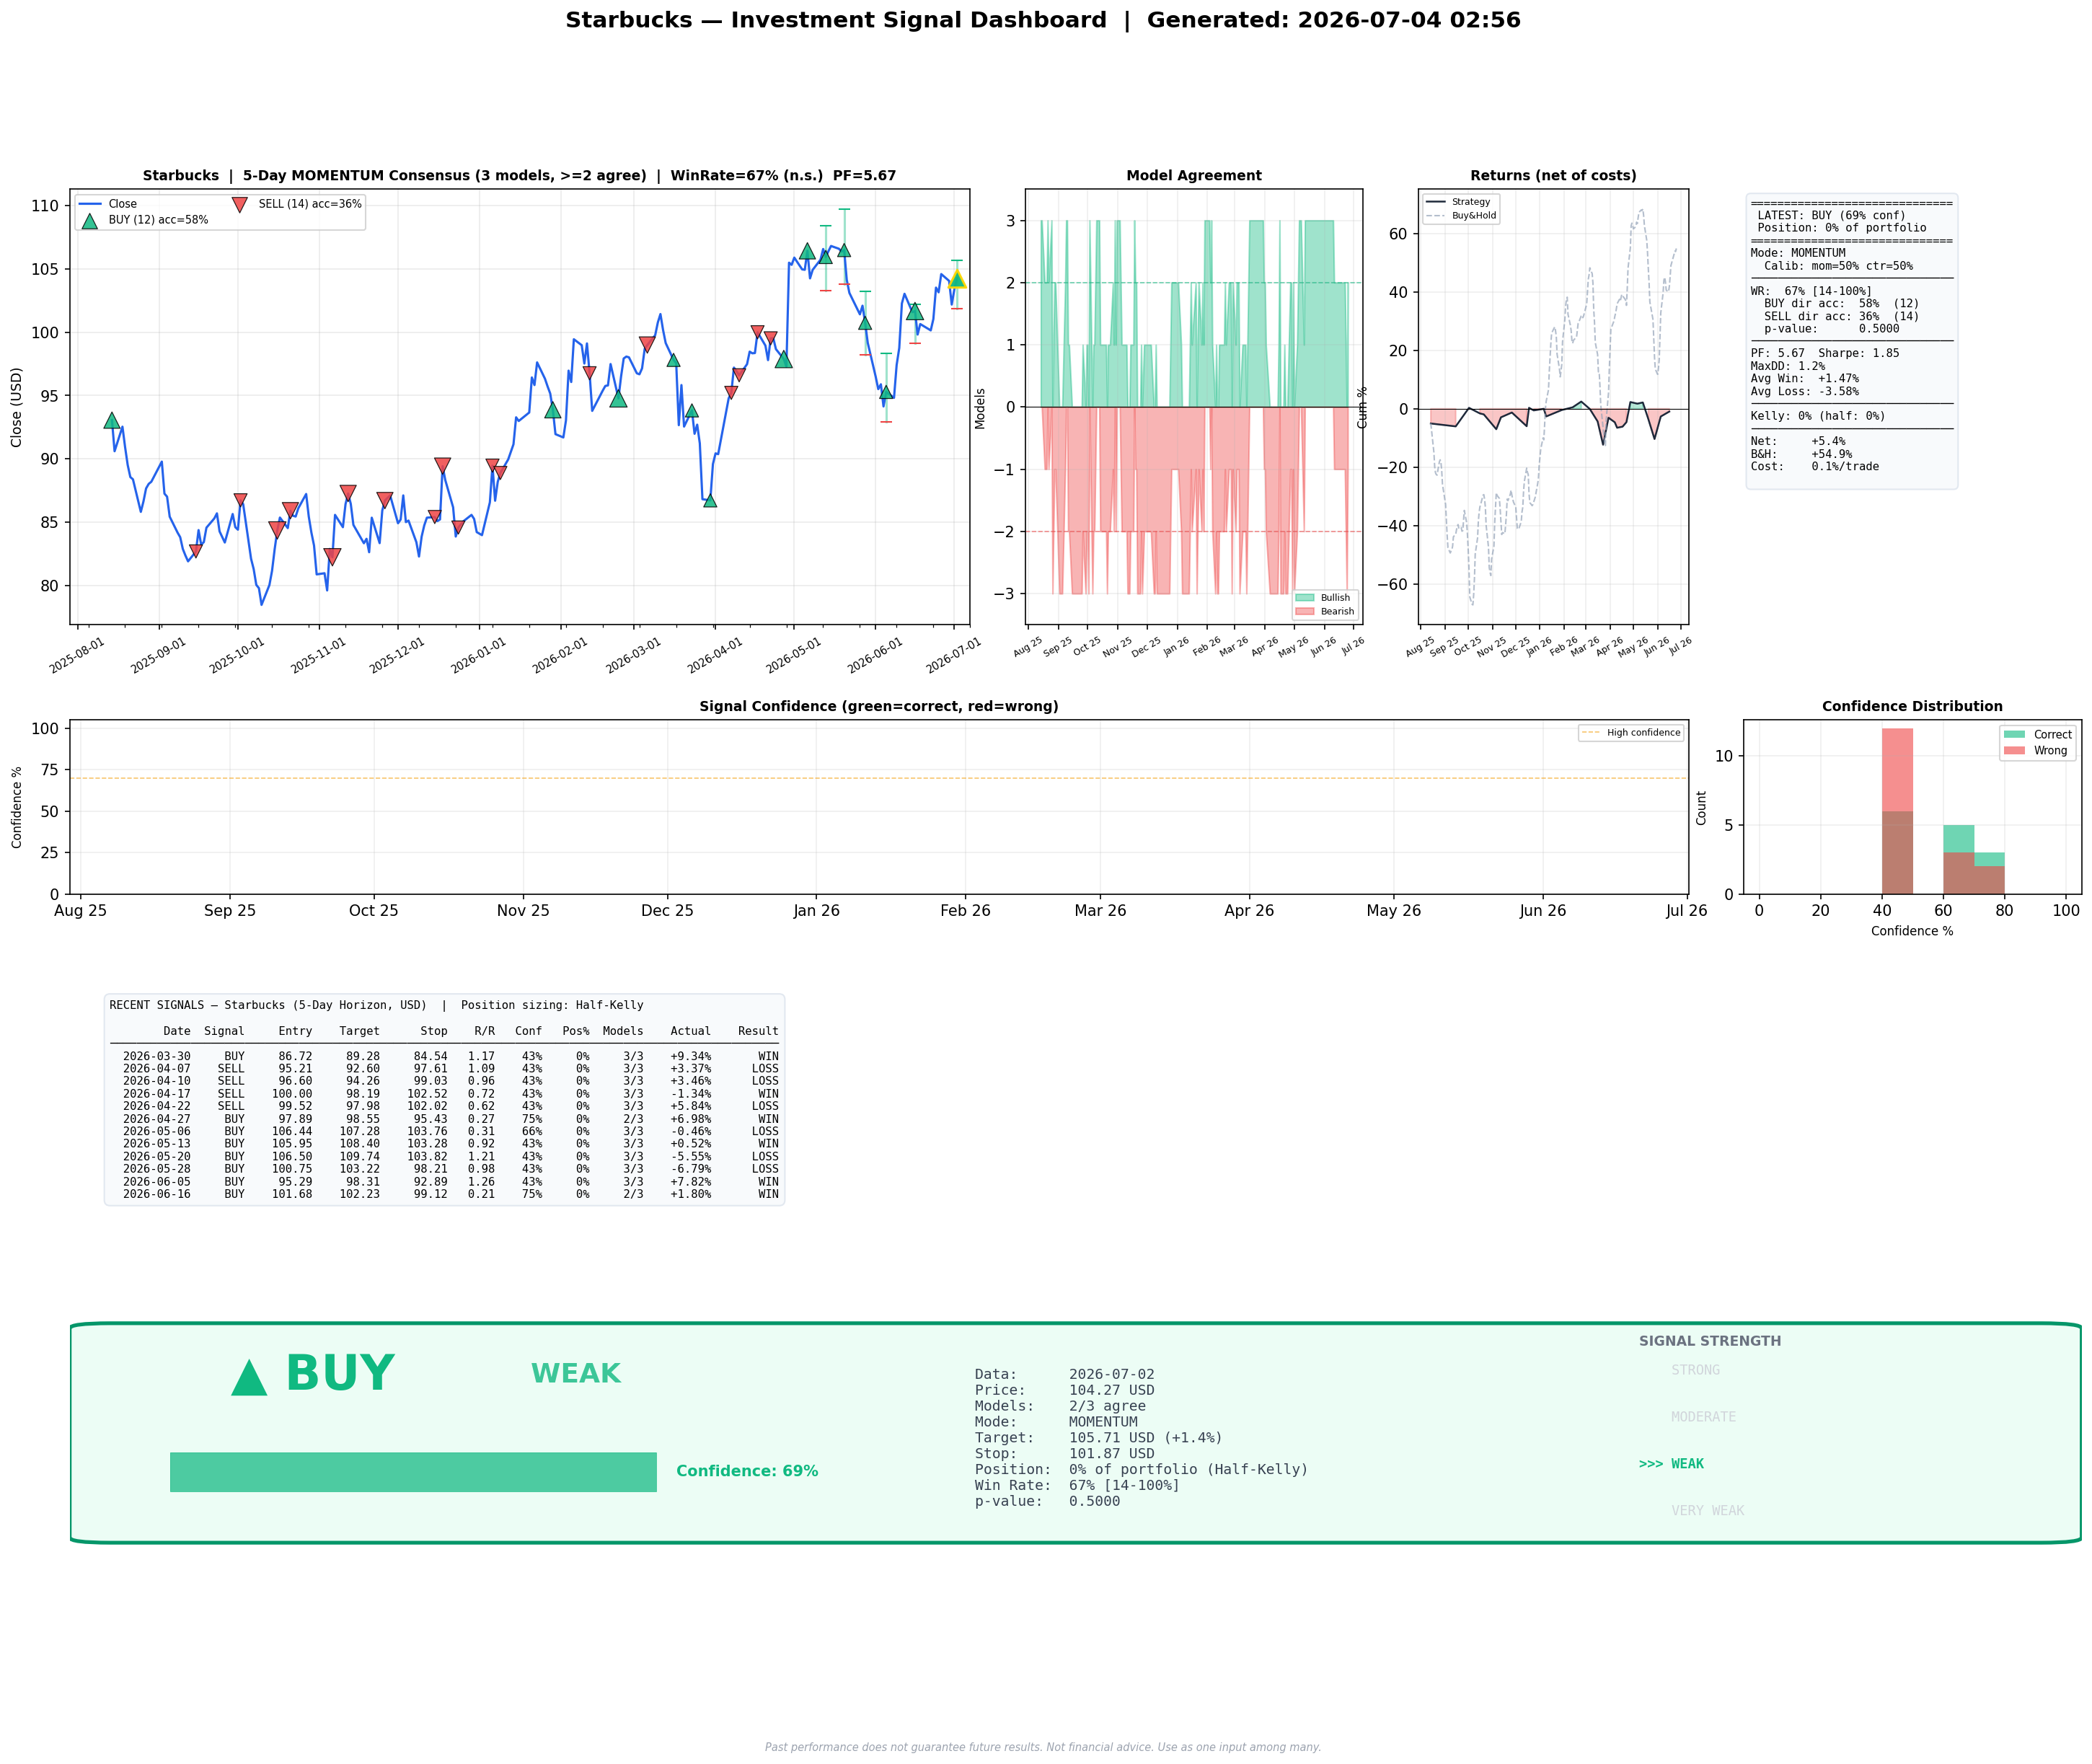
| SBUX | 2024.35 | $102.44 | $104.27 | $207,374 | $211,079 | $3,705 | 1.8% | 2026-07-01 02:53 |
| CASY | 131.94 | $784.28 | $797.42 | $103,481 | $105,215 | $1,734 | 1.7% | 2026-07-02 03:30 |
| NTRS | 635.60 | $175.45 | $176.50 | $111,517 | $112,184 | $667 | 0.6% | 2026-06-25 04:25 |
| MAR | 553.92 | $372.95 | $372.95 | $206,583 | $206,583 | $0 | 0.0% | 2026-07-03 03:29 |
| BNY | 566.48 | $146.62 | $146.62 | $83,058 | $83,058 | $0 | 0.0% | 2026-07-04 03:23 |
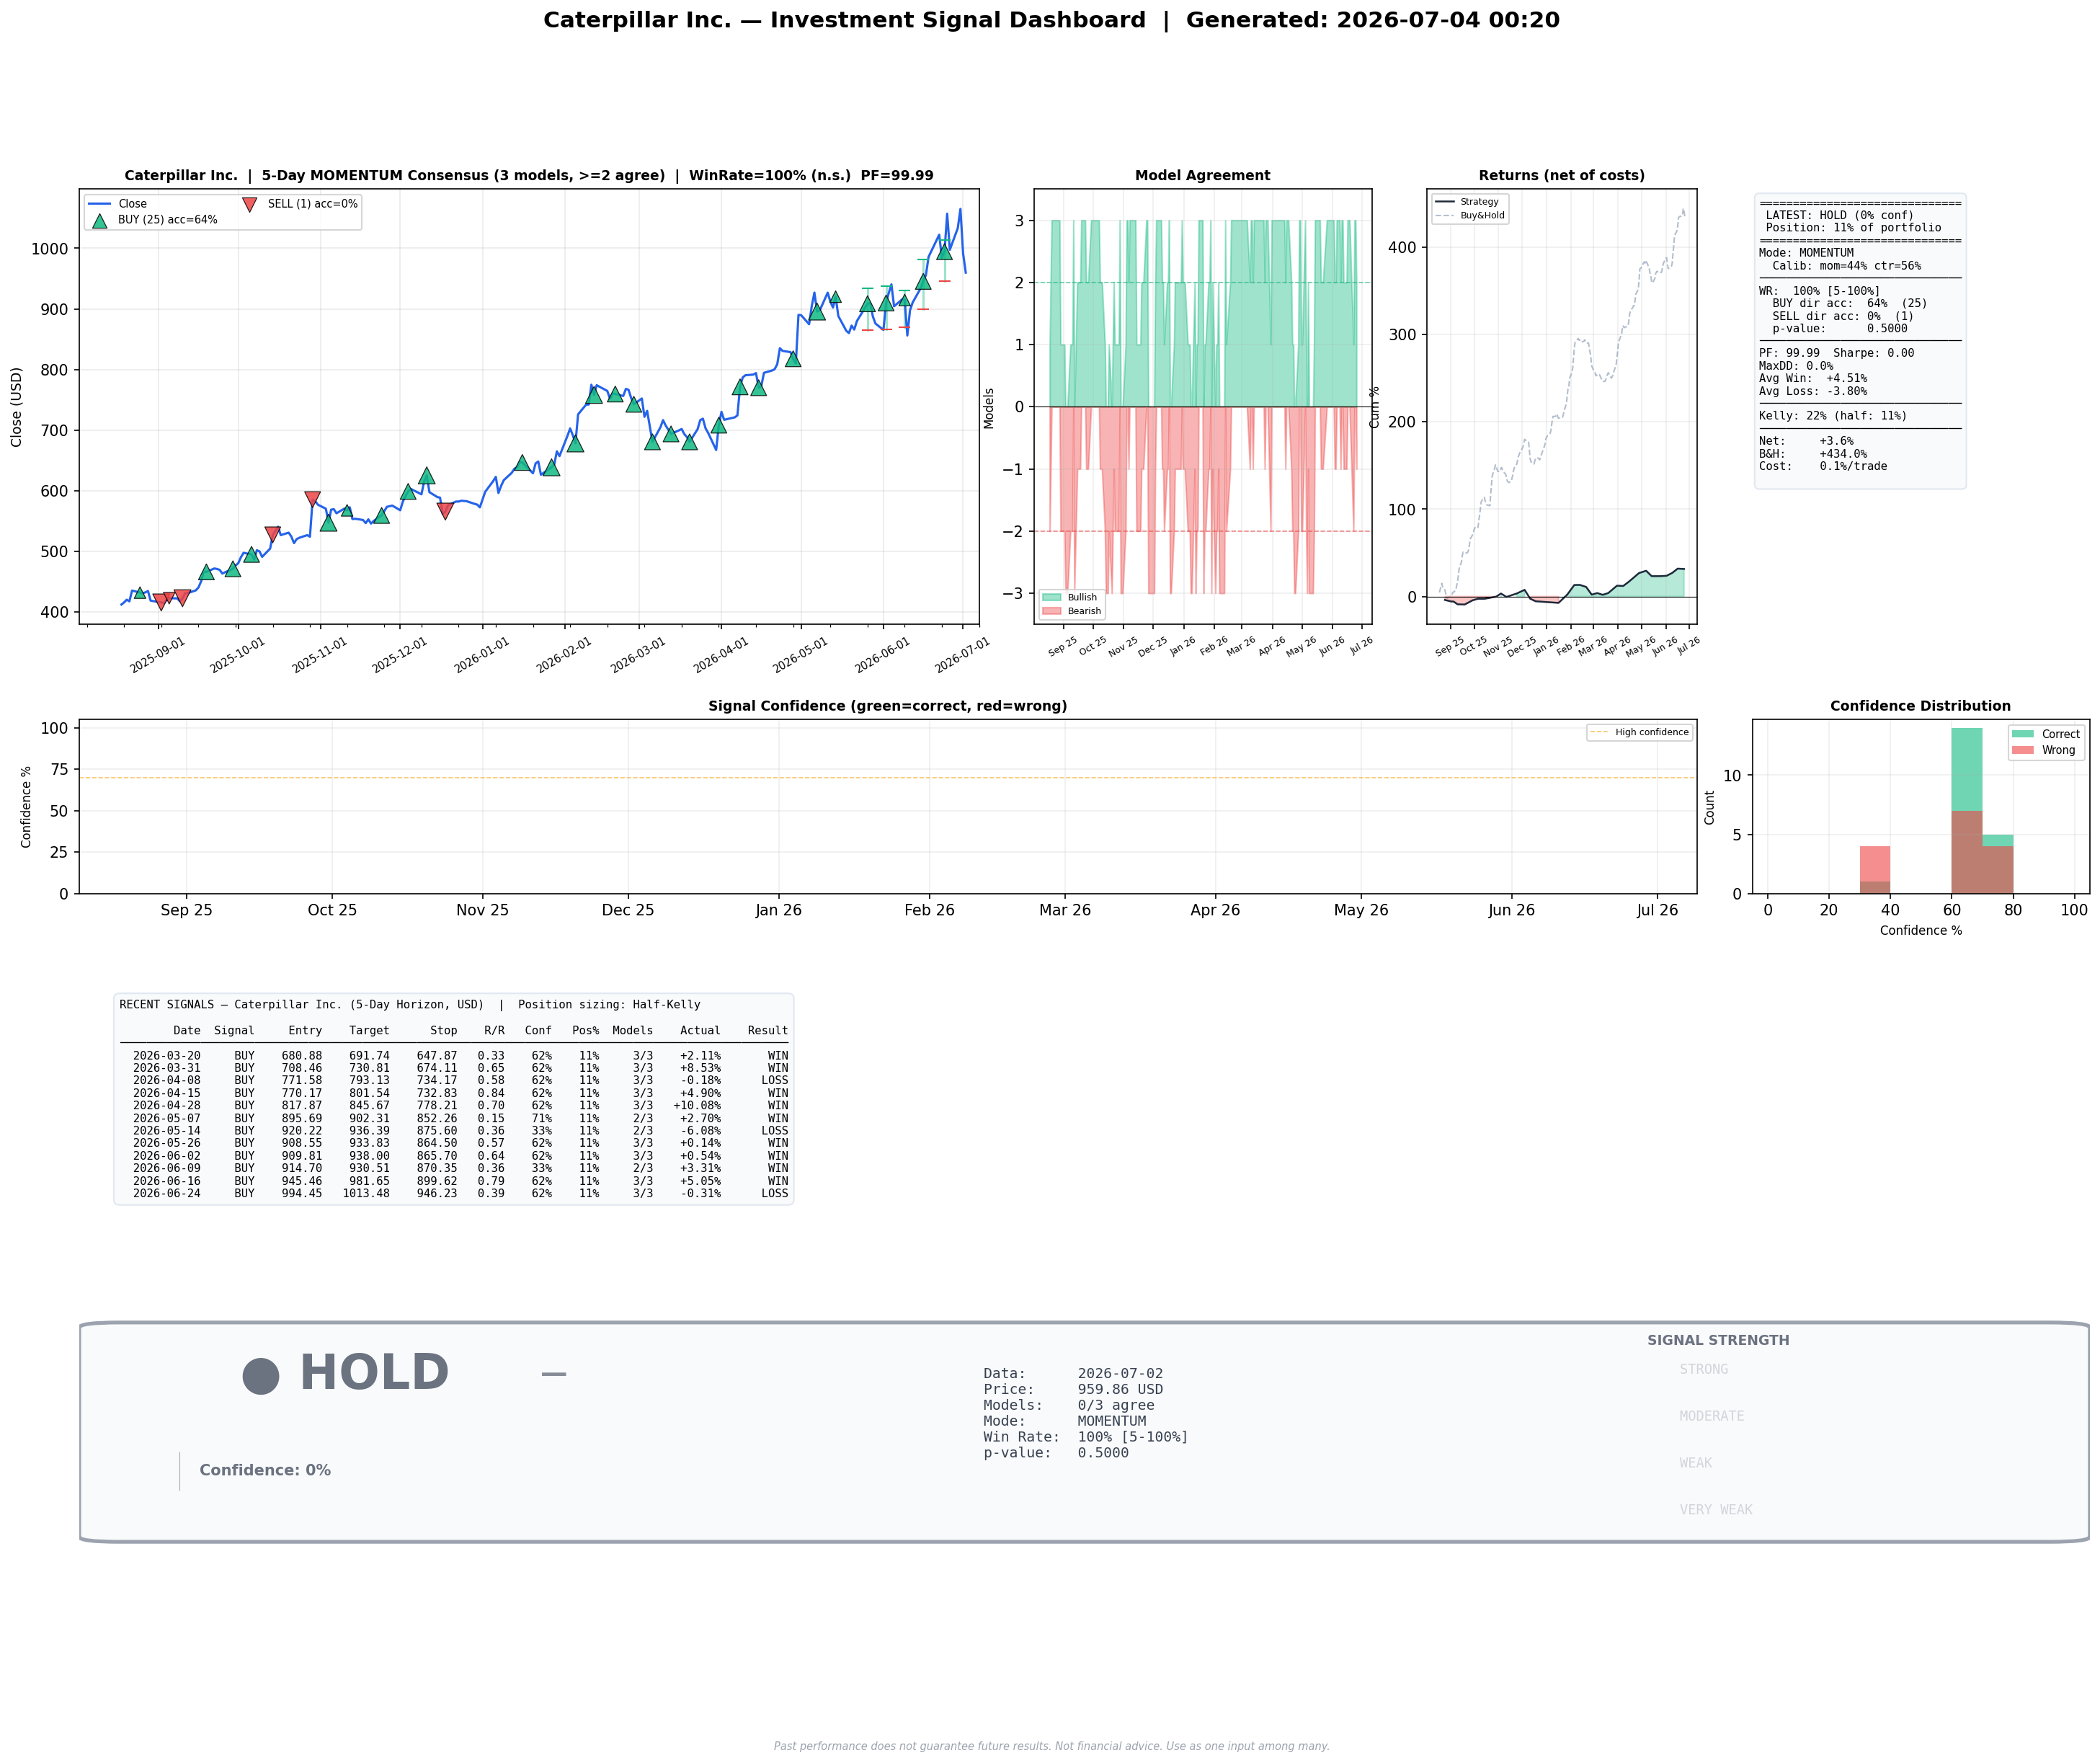
| CAT | 153.38 | $1001.28 | $963.53 | $153,574 | $147,784 | $5,790 | 3.8% | 2026-07-02 03:30 |
| HAL | 4736.84 | $34.28 | $32.96 | $162,376 | $156,126 | $6,250 | 3.8% | 2026-06-24 04:40 |
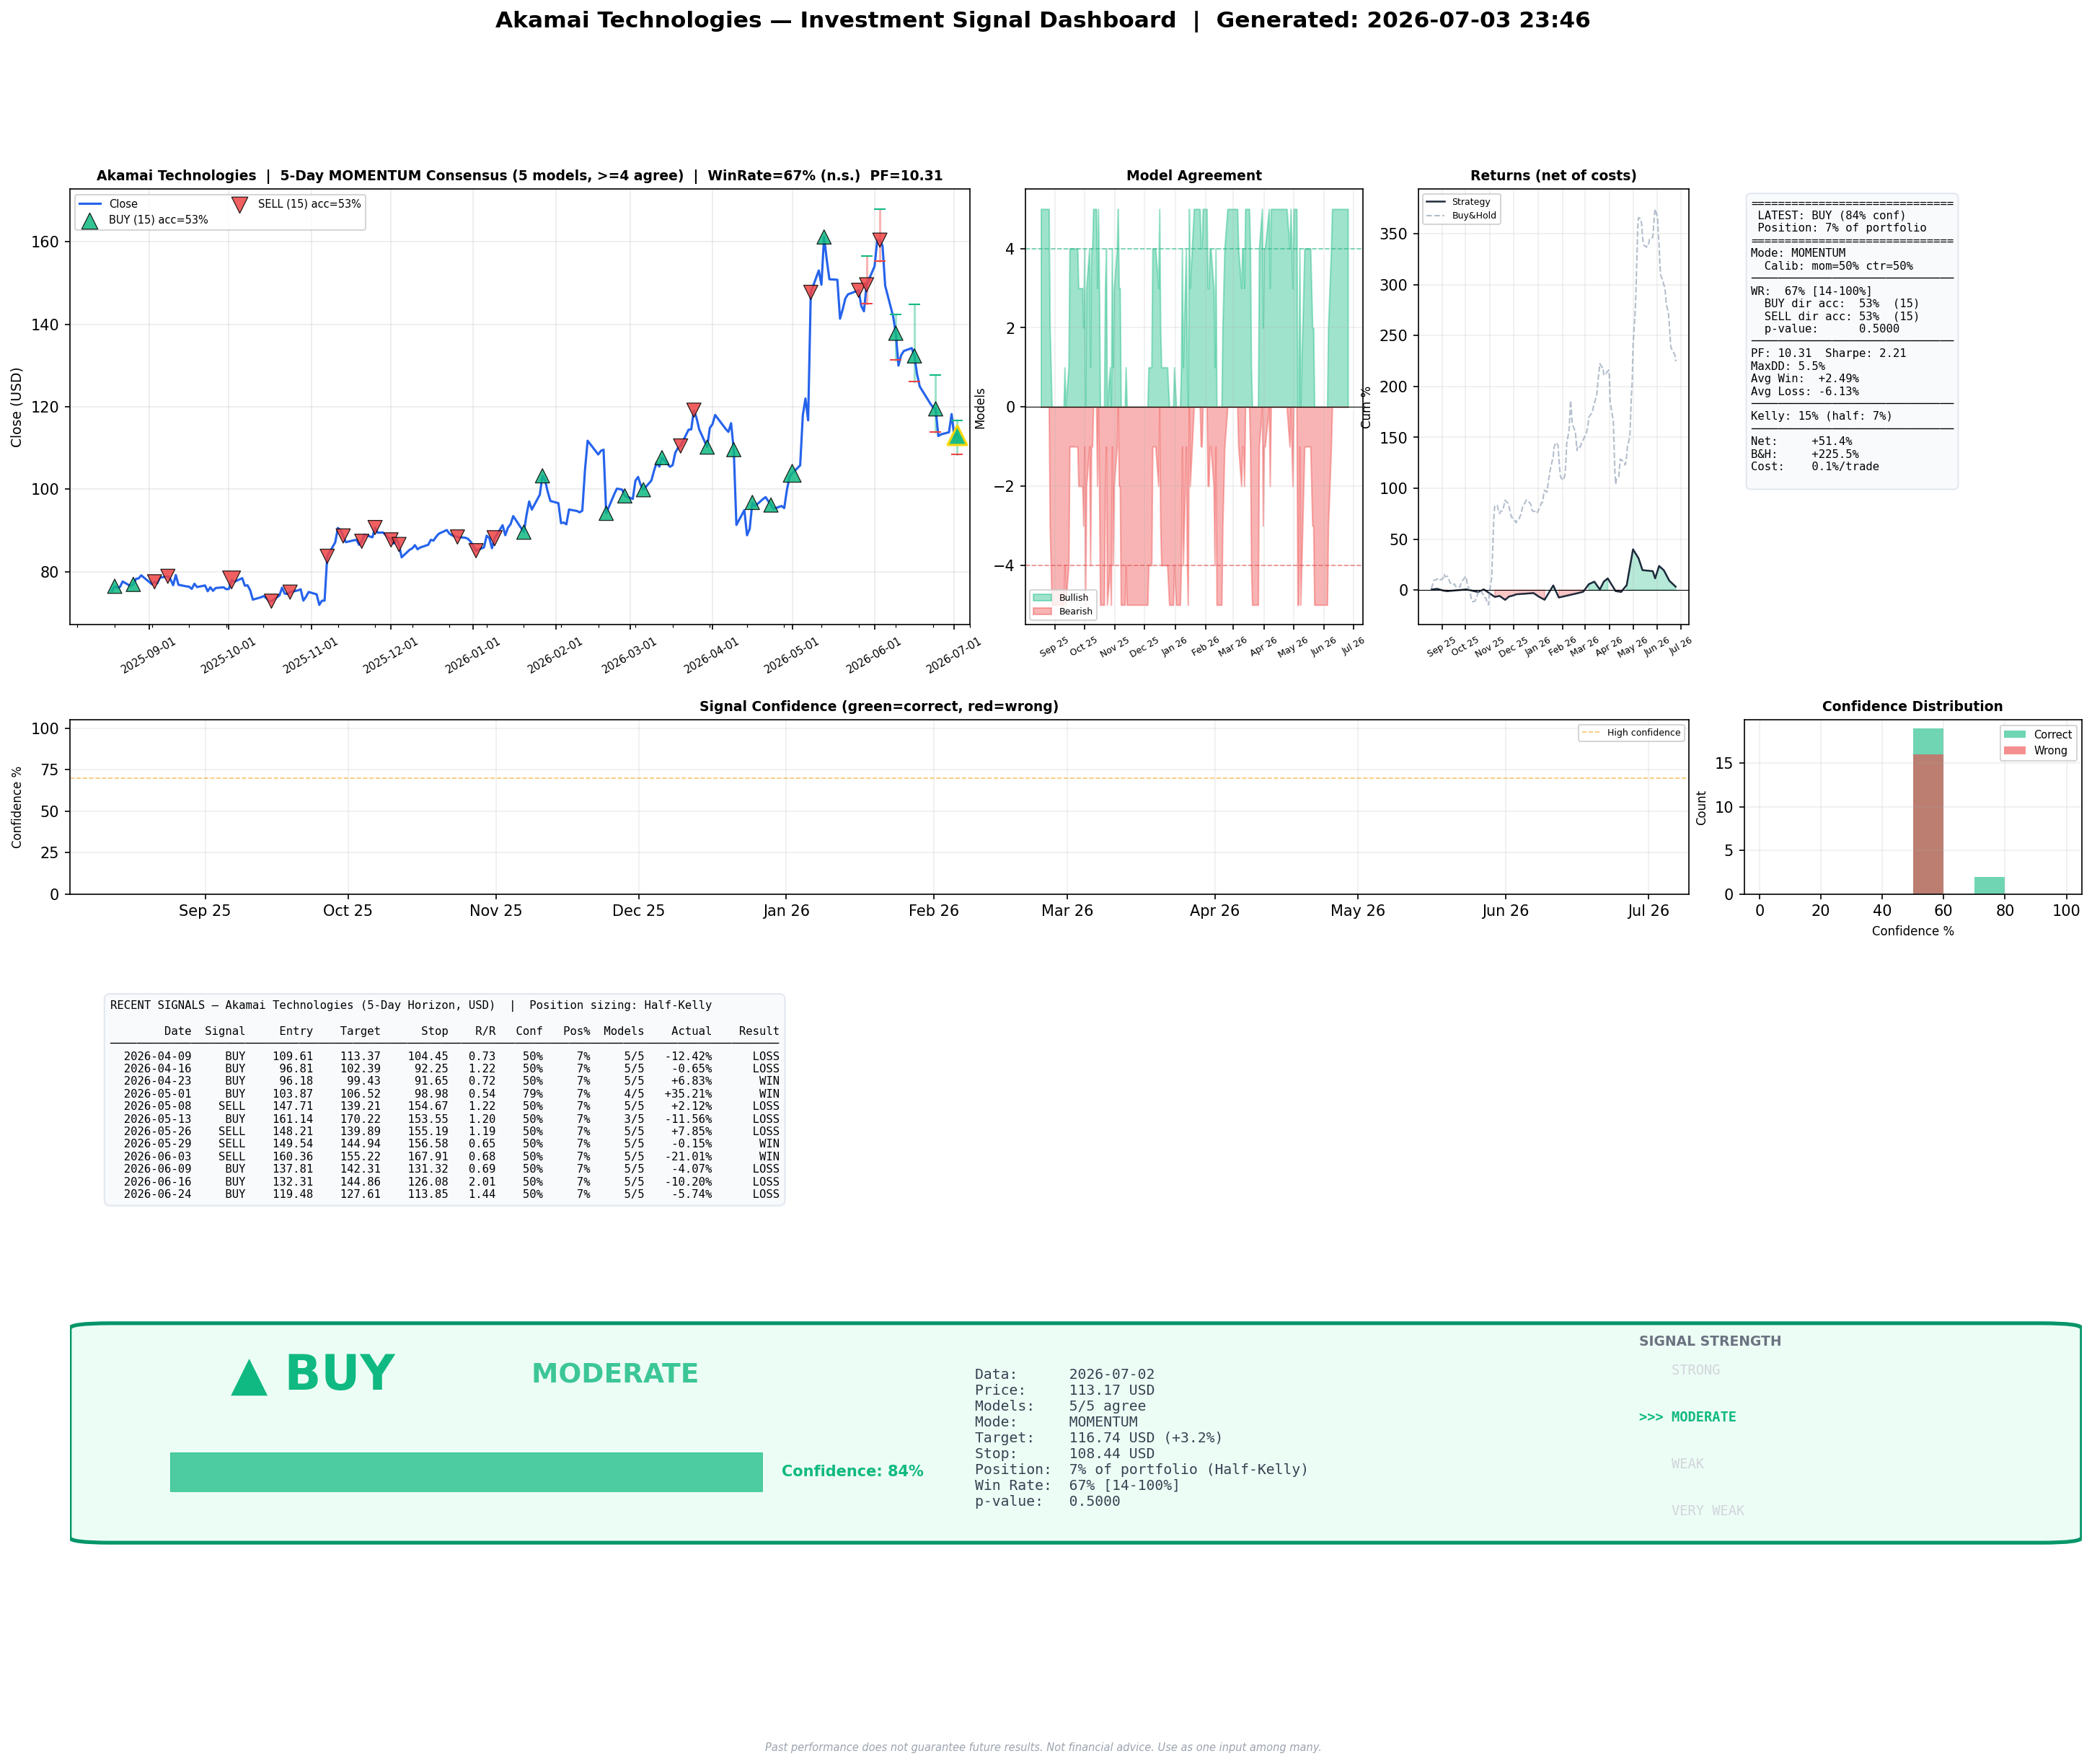
| AKAM | 1823.77 | $121.57 | $113.17 | $221,716 | $206,396 | $15,320 | 6.9% | 2026-06-25 04:25 |
| Ticker | Date | Action | Shares | Price | Amount | Friction | Vol | P&L |
|---|---|---|---|---|---|---|---|---|
| BNY | 2026-07-04 03:23 @ EOD close |
BUY | 566.48 | $146.62 | $83,058 | — | 0.86x | |
| MAR | 2026-07-03 03:29 @ EOD close |
BUY | 553.92 | $372.95 | $206,583 | — | 1.00x | |
| NTRS | 2026-07-03 03:29 @ EOD close |
SELL (trim) | 309.81 | $176.50 | $54,682 | — | $325 (0.6%) | |
| STX | 2026-07-02 17:00 @ next open |
SELL | 176.98 | $900.75 | $159,414 | — | $2,556 (1.6%) | |
| CASY | 2026-07-02 03:30 @ next open |
BUY | 131.94 | $784.28 | $103,481 | — | 0.58x | |
| CAT | 2026-07-02 03:30 @ next open |
BUY | 153.38 | $1001.28 | $153,574 | — | 0.74x | |
| VTR | 2026-07-02 03:30 @ next open |
BUY (topup) | 444.83 | $90.52 | $40,266 | — | 0.69xcap | |
| STX | 2026-07-02 03:30 @ next open |
BUY | 179.82 | $900.75 | $161,970 | — | 0.78x | |
| NTRS | 2026-07-02 03:30 @ next open |
SELL (trim) | 318.28 | $176.72 | $56,247 | — | $404 (0.7%) | |
| WAB | 2026-07-02 03:30 @ next open |
SELL | 371.22 | $265.56 | $98,581 | — | $1,609 (1.6%) |
| Ticker | Stop Date | Reason | P&L % | Days Remaining |
|---|---|---|---|---|
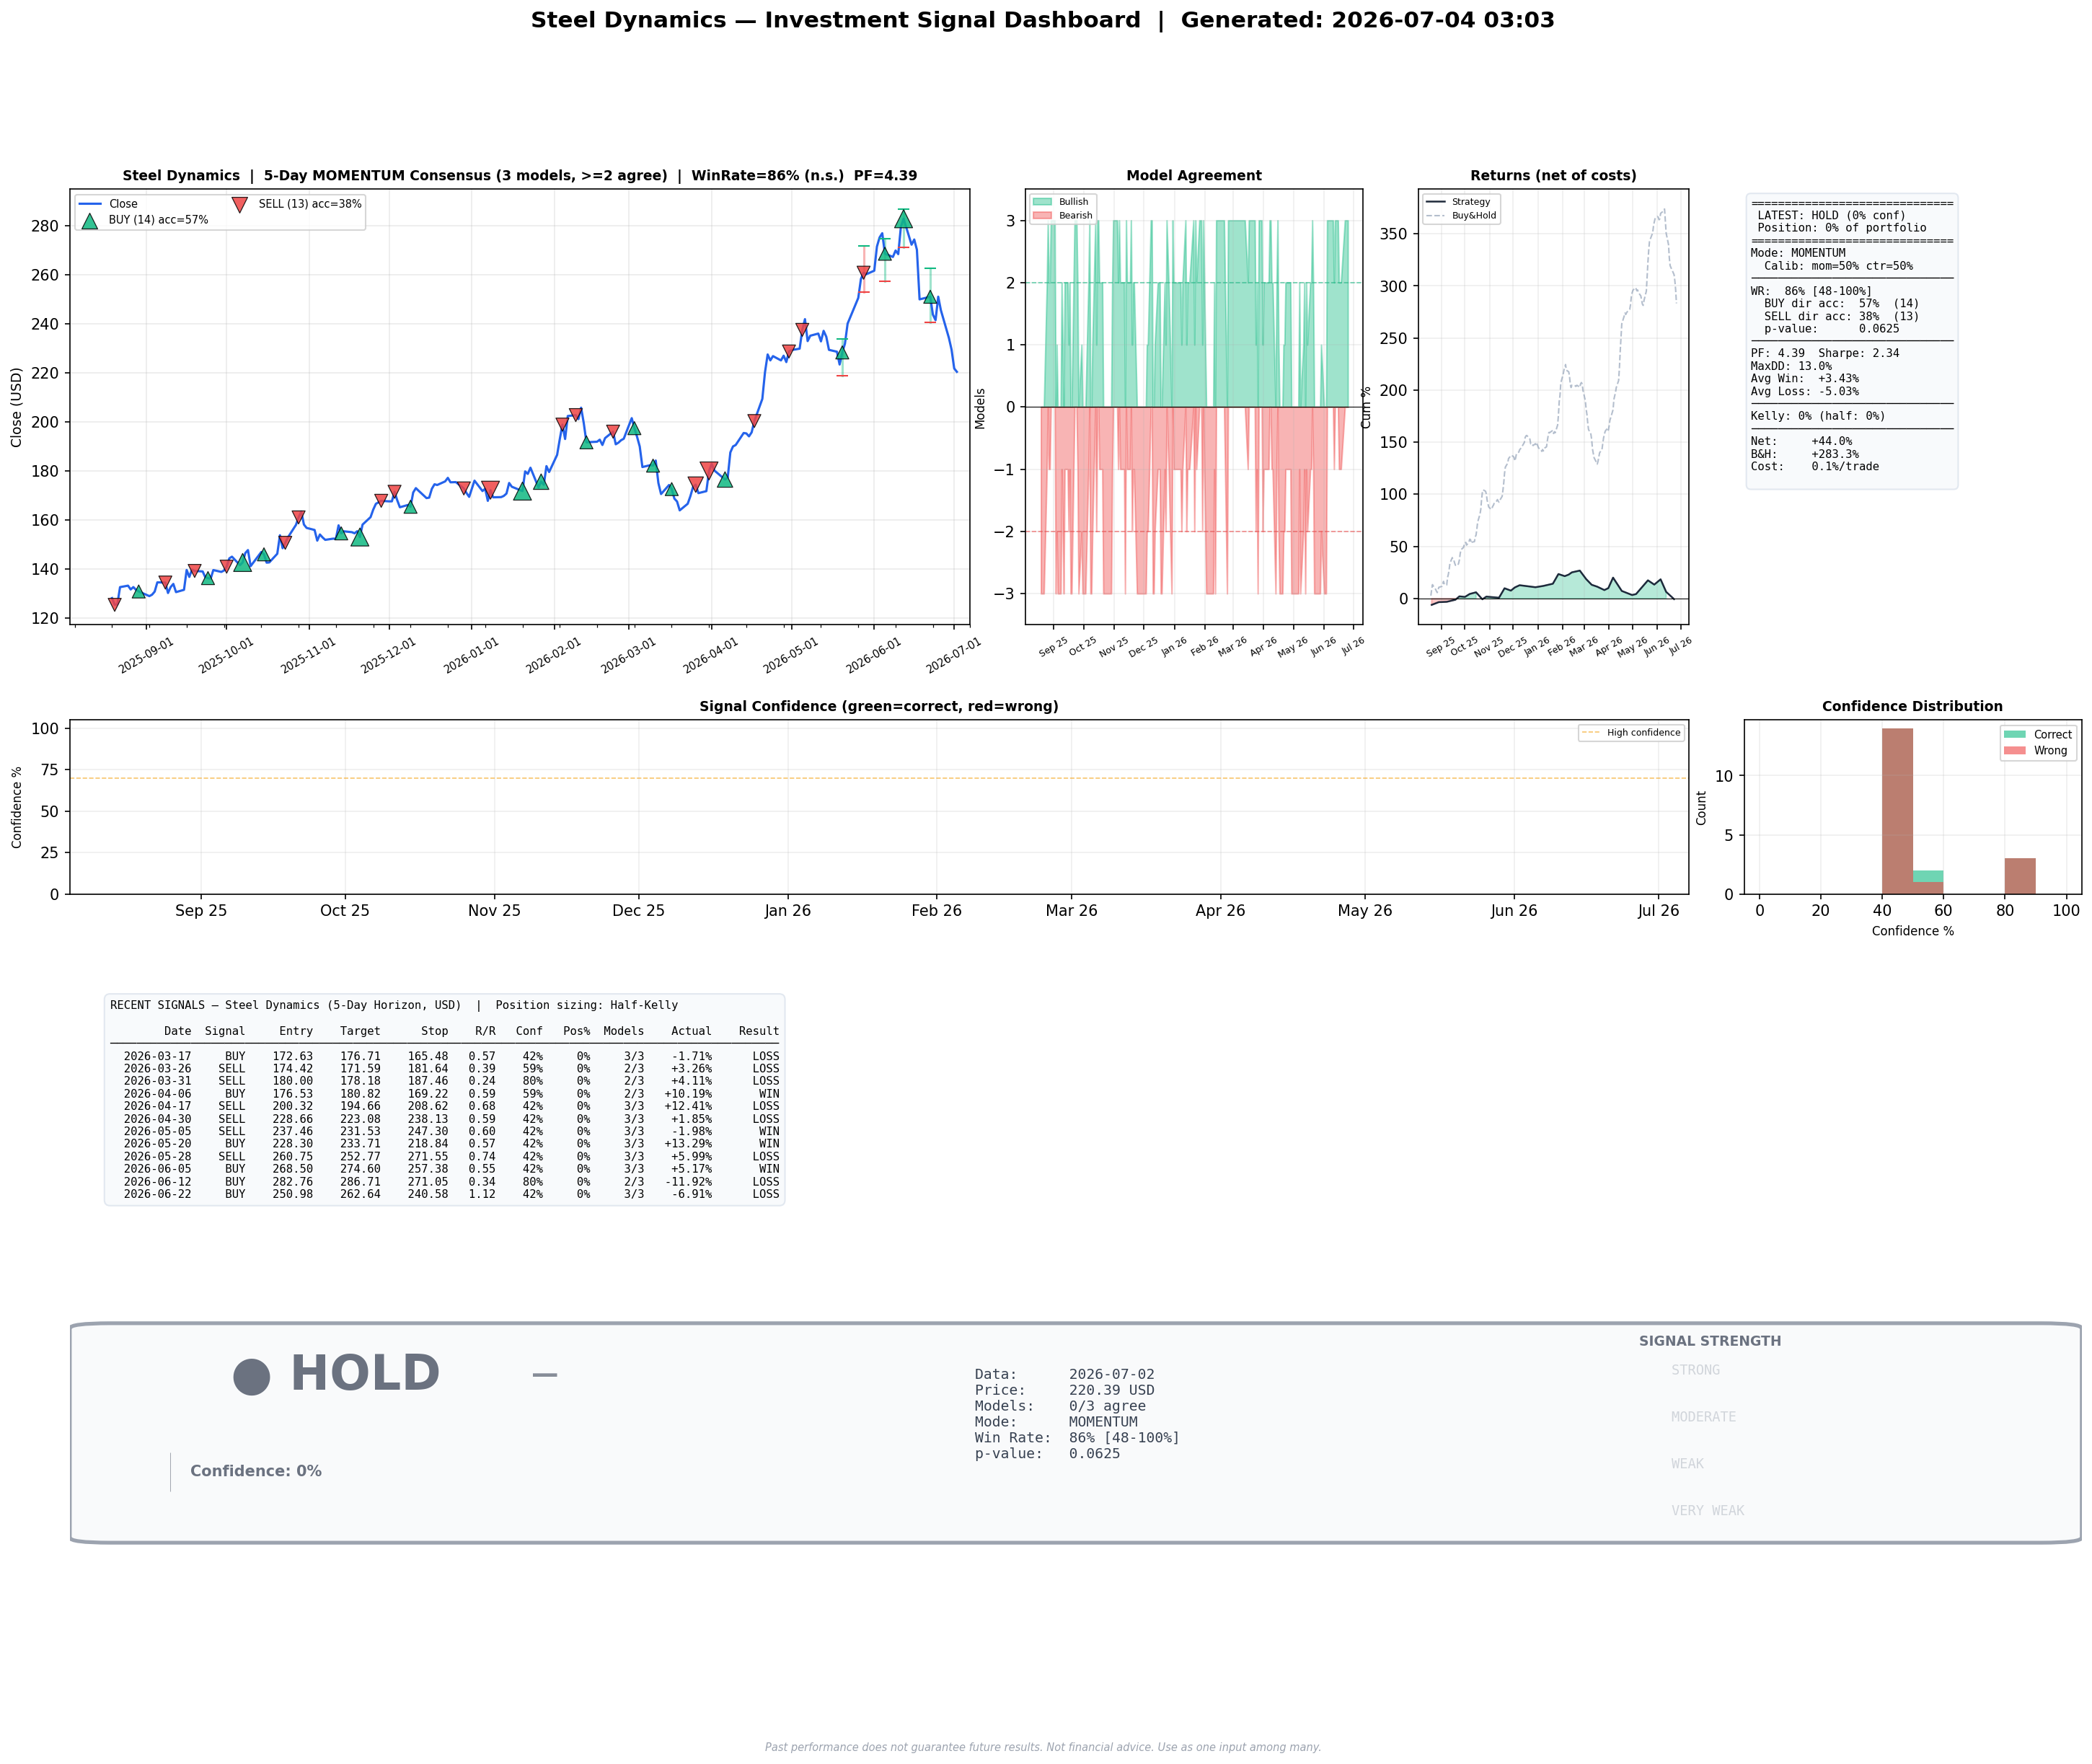
| STLD | 2026-07-01 | STOP-LOSS | -7.25% | 4 |
| DD | 2026-06-29 | STOP-LOSS | -7.37% | 2 |
| STX | 2026-07-02 | STOP-LOSS-CB | -10.20% | 5 |
BUY signals on cooled-down tickers are suppressed for 7 calendar days.
Total value: $492,267 (-1.55% retroactive since 2026-05-29) — actual portfolio $490,264 (-1.95% since real inception)
Holding: SPY (658.27 sh @ $759.57, entry 2026-06-03, now $744.78, unrealized -$9,736/-1.95%)
Comparison (retroactive since 2026-05-29): main system +0.92% vs Antonacci -1.55% (+2.47pp)
Indicators — 12m: SPY=+20.0%, TLT=-2.4%, GLD=+22.3%, BIL=-0.0%; 6m: SPY=+9.0%, TLT=-1.8%, GLD=-5.1%, BIL=+0.0%; SPY>200d ✓; TLT<200d ✗; GLD<200d ✗; BIL<200d ✗
Last decision (2026-07-03): HOLD — Hold SPY (still best eligible, 6m +9.02%, 12m +20.04%)
Cycle 25: 500/502 tickers processed (99.6%). Avg 89.0s per ticker. Awaiting backfill: 3 new index member(s) under the 200-day minimum (HONA 13d, FDXF 26d, Q 171d). Auto-resolves with time. Top candidates: SNA (score=0.88, n=8), MAR (score=0.79, n=8), STLD (score=0.64, n=6), VLO (score=0.62, n=7), TGT (score=0.61, n=7).
Certify pass: 0 of 60 certified (0.0%), 60 remaining in queue.
Adaptive catalog (cycles [22, 23, 24]): CATALOG NARROW — avg swap 41%. drop mixed_5 (won 29 of 227 cells in last 3 cycles)
load avg 0.34. processes: run_daily, web_server.
portfolio_execute._process_fresh_buy not yet confirmed written and merged, and (2) AAPL.csv not confirmed updated with price data past 2026-06-26. Today's data shows no new AAPL bypass in negative_cert_sp5_buy_alerts (the same historical entry from 2026-06-29 is the only record), but neither sub-item carries a confirmed-resolved signal in today's data. Both remain open until explicit engineering confirmation is provided.portfolio_active_cooldowns shows STX with 5 days remaining on its stop cooldown. Today's walk-forward shows STX signal = BUY with strong metrics (runtime_sharpe 3.38, 100% win rate, n_signals 4), and no re-entry appears in portfolio_recent_trades. The stop cooldown is correctly suppressing re-entry. No gate bug; system working as designed.stop_pnl_pct = −10.2% while the trade record shows realised P&L of −1.58%. Today's portfolio_active_cooldowns still shows STX stop_pnl_pct = −10.2, consistent with yesterday's observation. The hypothesis that the cooldown field captures ATR-trigger percentage distance from cost basis rather than realised P&L has not been confirmed or refuted by today's data. The field definition audit remains open.Due now:
Upcoming grades: pre_open_gap_gate in 6d (2026-07-10).
| Gate | 30d-inf | 30d-cash | 60d-inf | 60d-cash | 90d-inf | 90d-cash |
|---|---|---|---|---|---|---|
| bootstrap_ci_gate | +40,849 | +40,889 | -26,982 | -82,099 | -46,109 | -10,350 |
| legacy_n_lt_5 | -31,840 | -22,528 | -41,878 | -10,038 | -21,050 | +20,829 |
| legacy_quality | -8,797 | -17,494 | +9,646 | +949 | -43,616 | -38,267 |
| topup_cooldown | — | — | -1,671 | -1,671 | +37,288 | -0 |
Reading the table: each cell is the gate's alpha contribution over that window — positive (green) = the gate saved money by blocking losing trades, negative (red) = the gate cost money by blocking winners. Gates were deployed to prevent rare large losses (FCX-class -$15K). A 30-day window may not contain such an event; the gate's value is in tail-risk, not average-window P&L.
portfolio_execute._process_fresh_buy should have suppressed this — investigate which code path landed the order. Two sub-items remain open: (1) integration test covering the cert-floor rejection path in portfolio_execute._process_fresh_buy has not been confirmed written and merged; (2) AAPL.csv has not been confirmed updated with price data past 2026-06-26. Until both are confirmed closed, any future AAPL signal evaluation rests on stale CSV data and the rejection path is untested end-to-end.stop_pnl_pct = −10.2% against a realised trade P&L of −1.58%. The leading hypothesis is that the cooldown field captures the ATR-trigger percentage distance from cost basis (i.e., the trigger level is ~10.2% below the cost-basis reference) rather than the realised exit P&L. Confirm the field definition in the cooldown schema and add a code comment or schema annotation clarifying which quantity is stored, to prevent future misreading of this field in postmortems or monitoring dashboards.tree_heavy_5, $103,480, 131.94 shares) does not carry a cert_sp5_at_entry field in portfolio_recent_trades, unlike the contemporaneous STX and CAT entries which do. If this field is populated upstream for all fresh BUYs, its absence here warrants a check of whether the cert lookup succeeded for CASY at execution time. If the tree_heavy_5 committee variant does not expose a scalar cert_sp5 comparable to the floor, confirm that the gate evaluation path handles this variant correctly and that the absence of the field is intentional rather than a silent lookup failure.decision_date = 2026-07-02, a two-day gap between decision and execution. The trade also shows priced_from = placeholder_close. Confirm this lag is attributable to a holiday or weekend fill-delay cycle (2026-07-04 is US Independence Day) and that the placeholder price will be repriced against a real fill before P&L attribution is finalised.priced_from = placeholder_close with reprice_attempts = 1. Verify the reprice cycle completes and that the final fill price is recorded before this trade feeds into realised P&L or drawdown calculations.meta_decide.py CLI.
~/Money/meta_proposals.md)vol_scalar_near_full_cohort_tag
closure_log.py:_build_closure_record — add near_full_vol_scalar_at_entry boolean field computed from vol_scalar_at_entry stored at trade open
| Check after: 60 days
| ✓ claims additive
negative_cert_sp5_buy_alert
brief_data.py:_collect_data — add _check_negative_cert_sp5_buys helper called from here that scans recent trade log for cert_sp5_at_entry < 0 on BUY executions
| Check after: 30 days
| ✓ claims additive
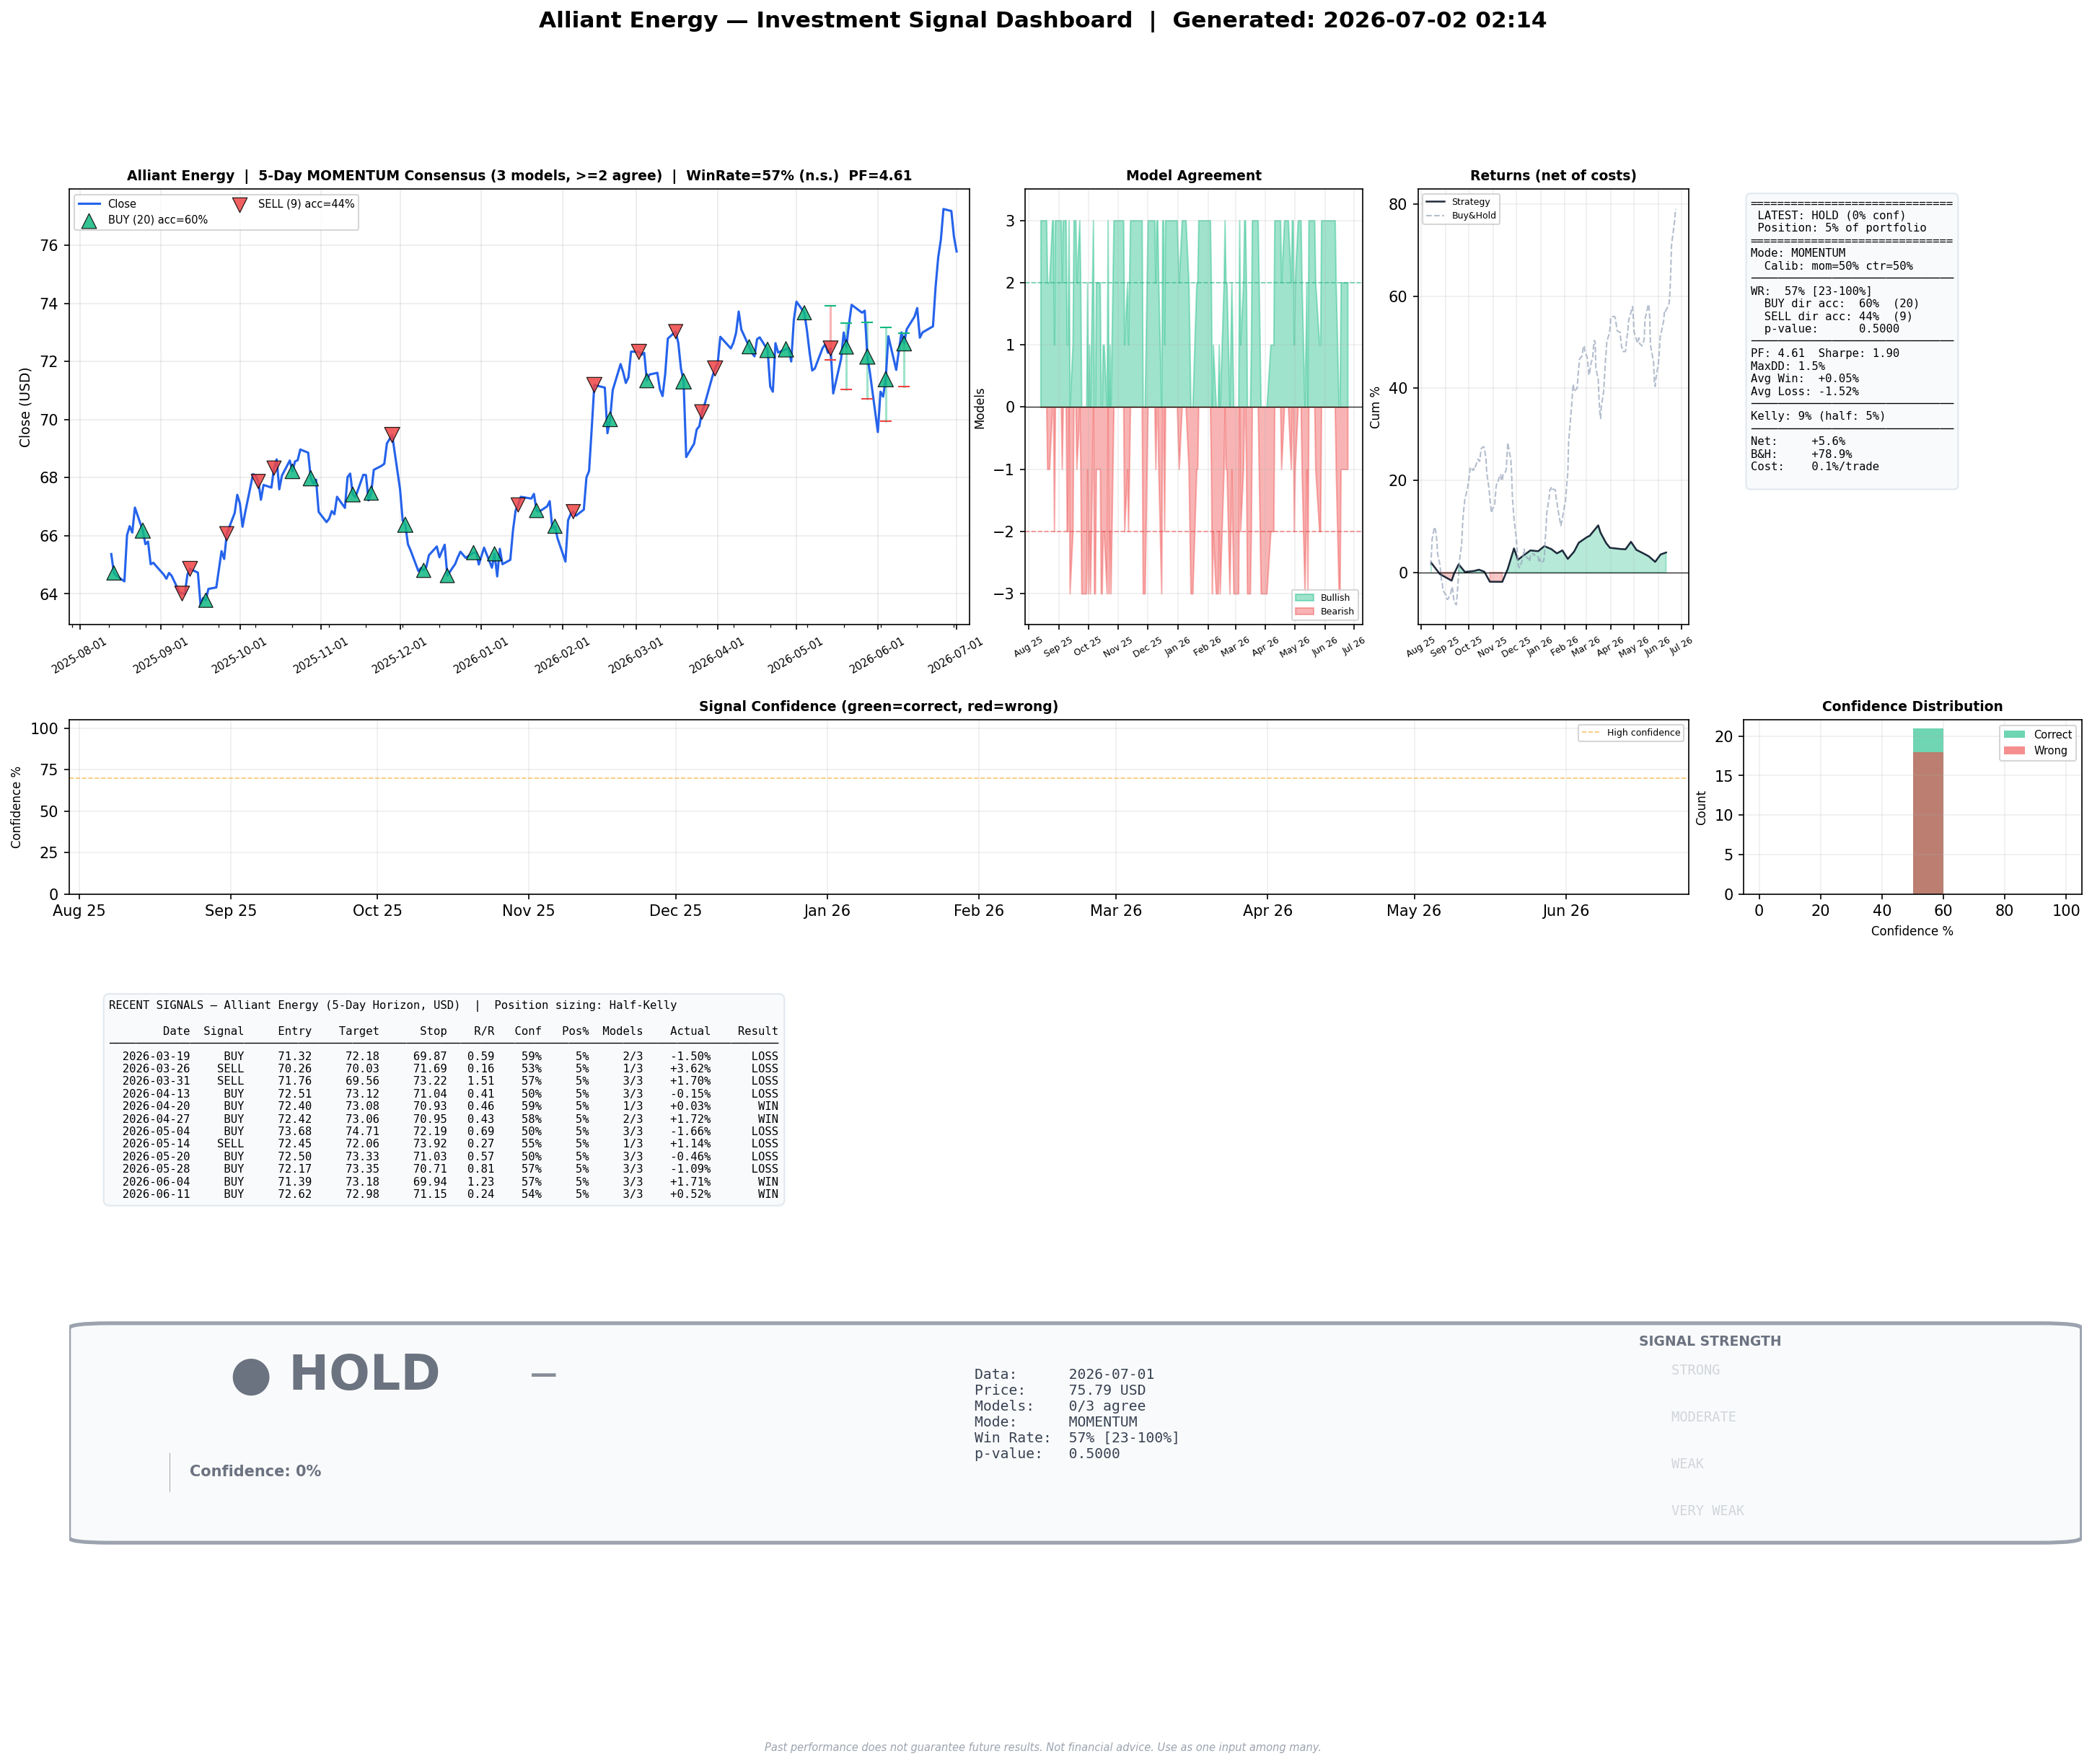
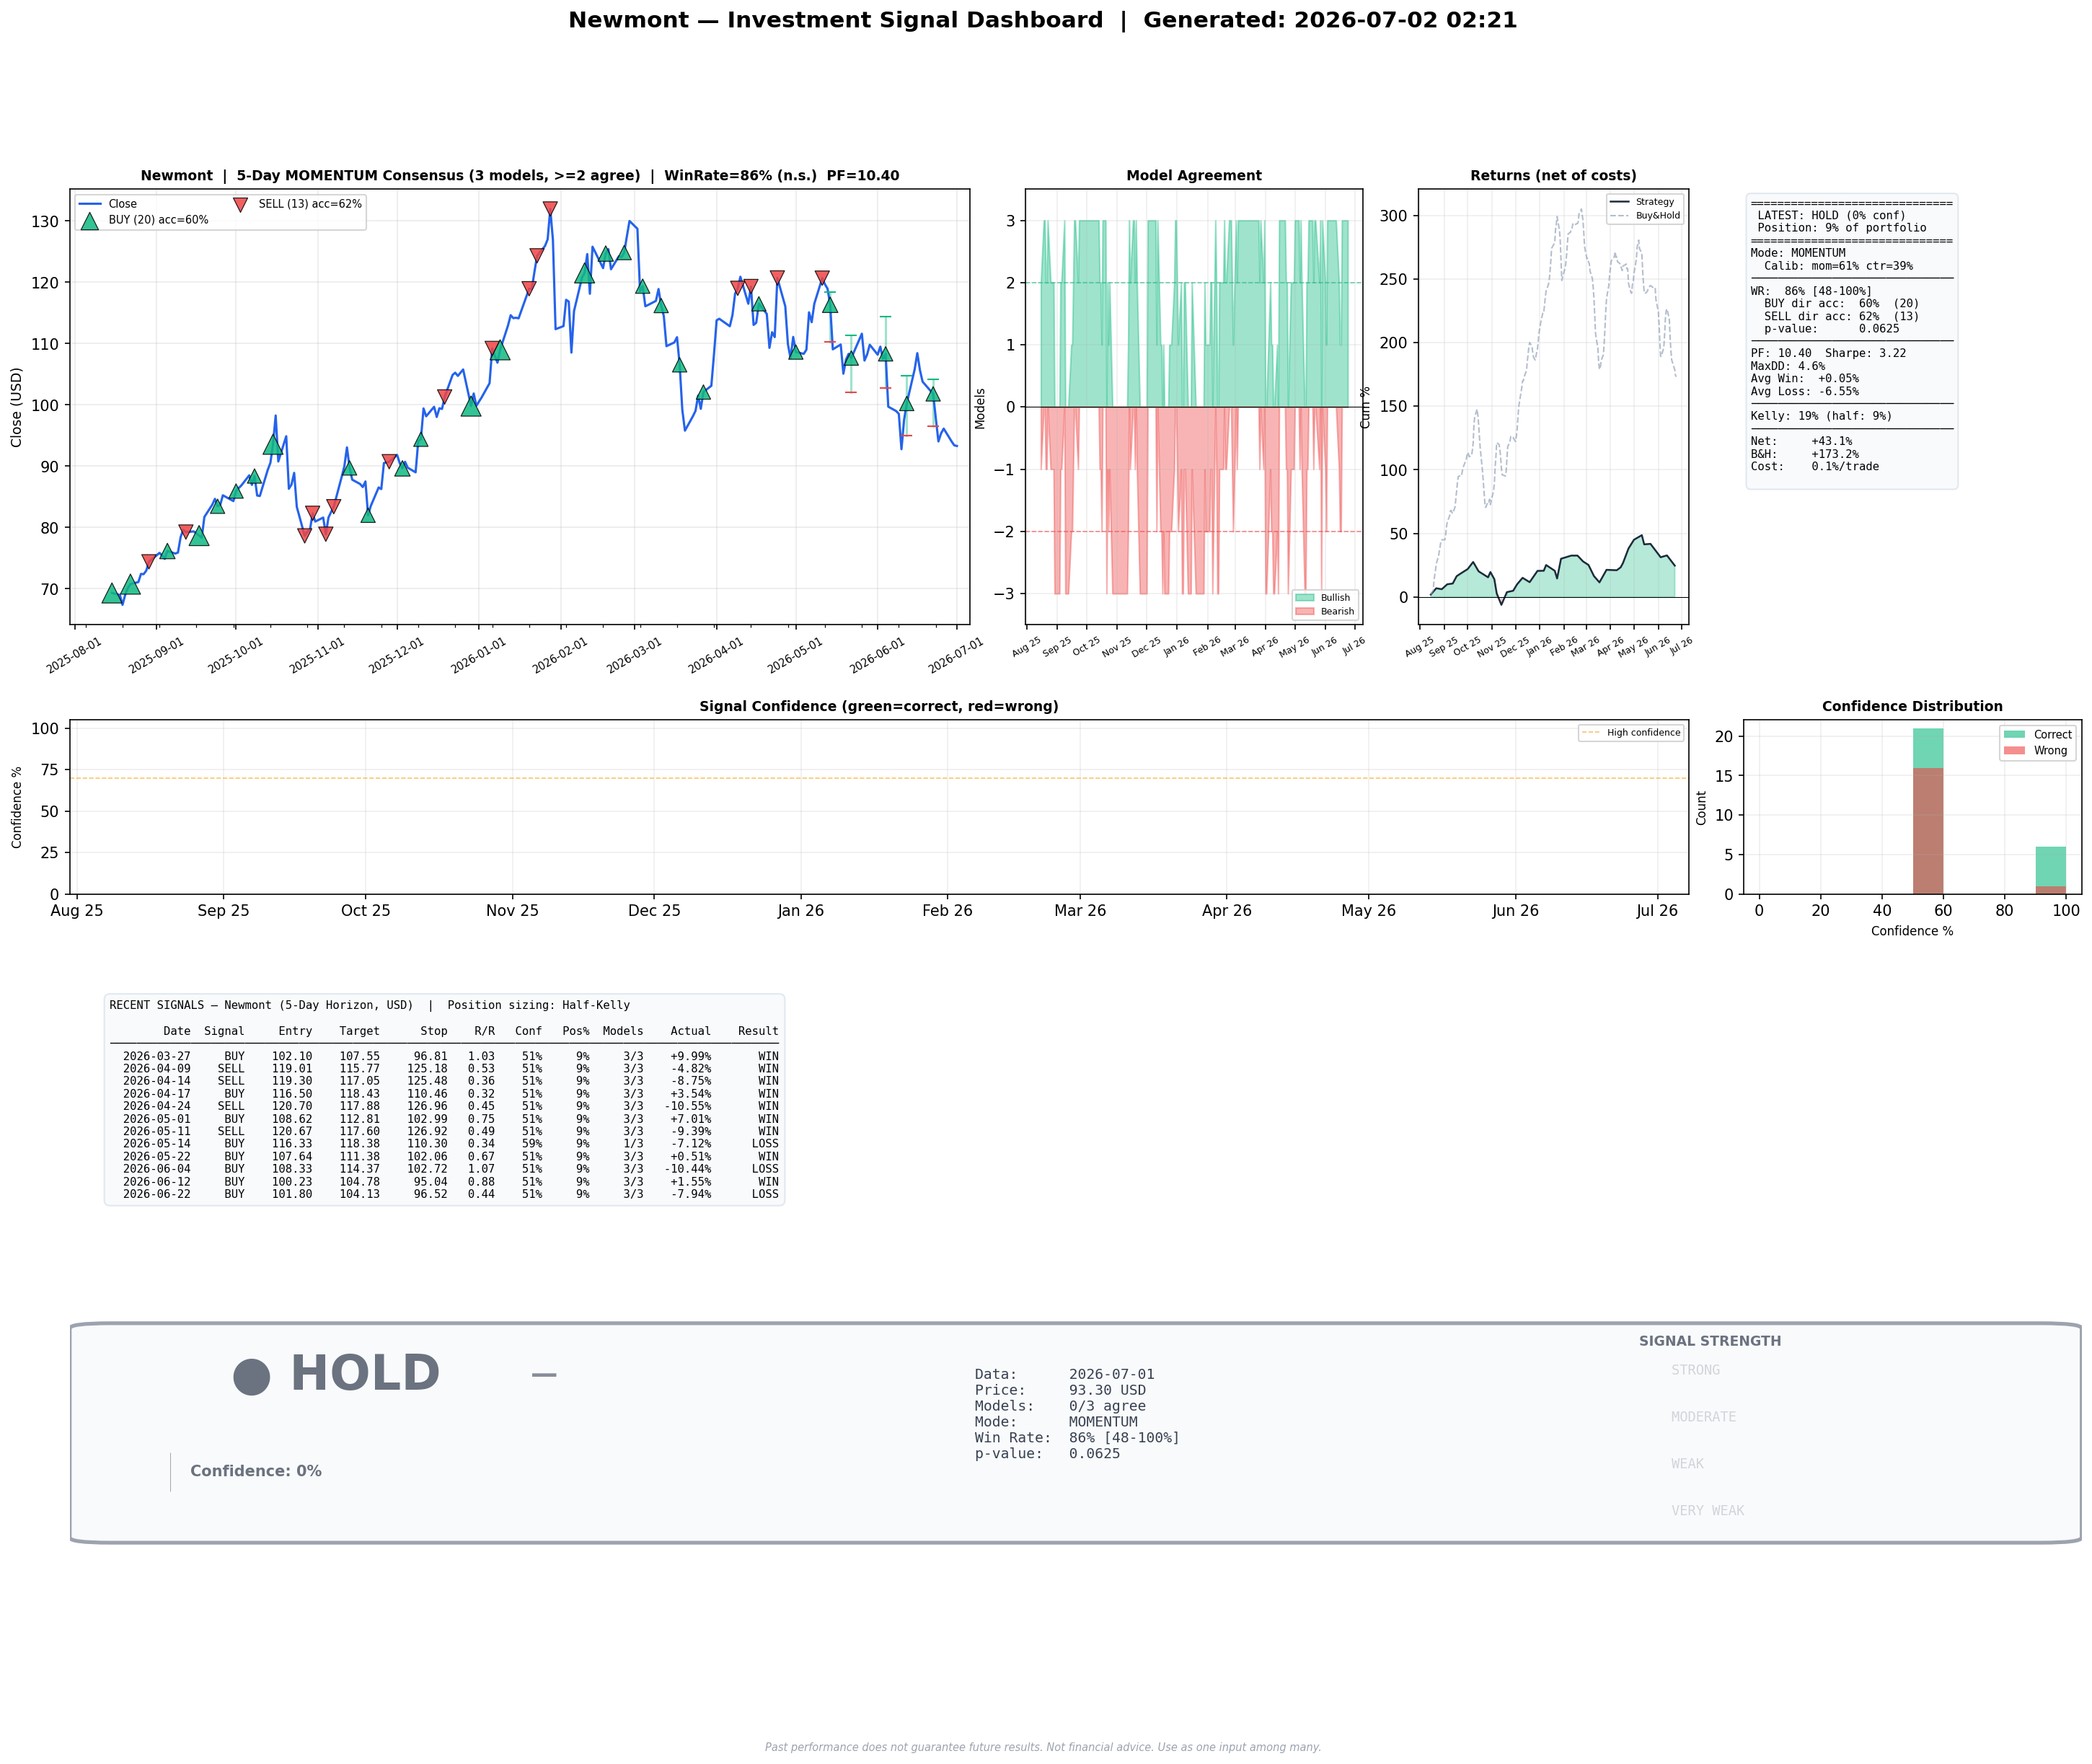
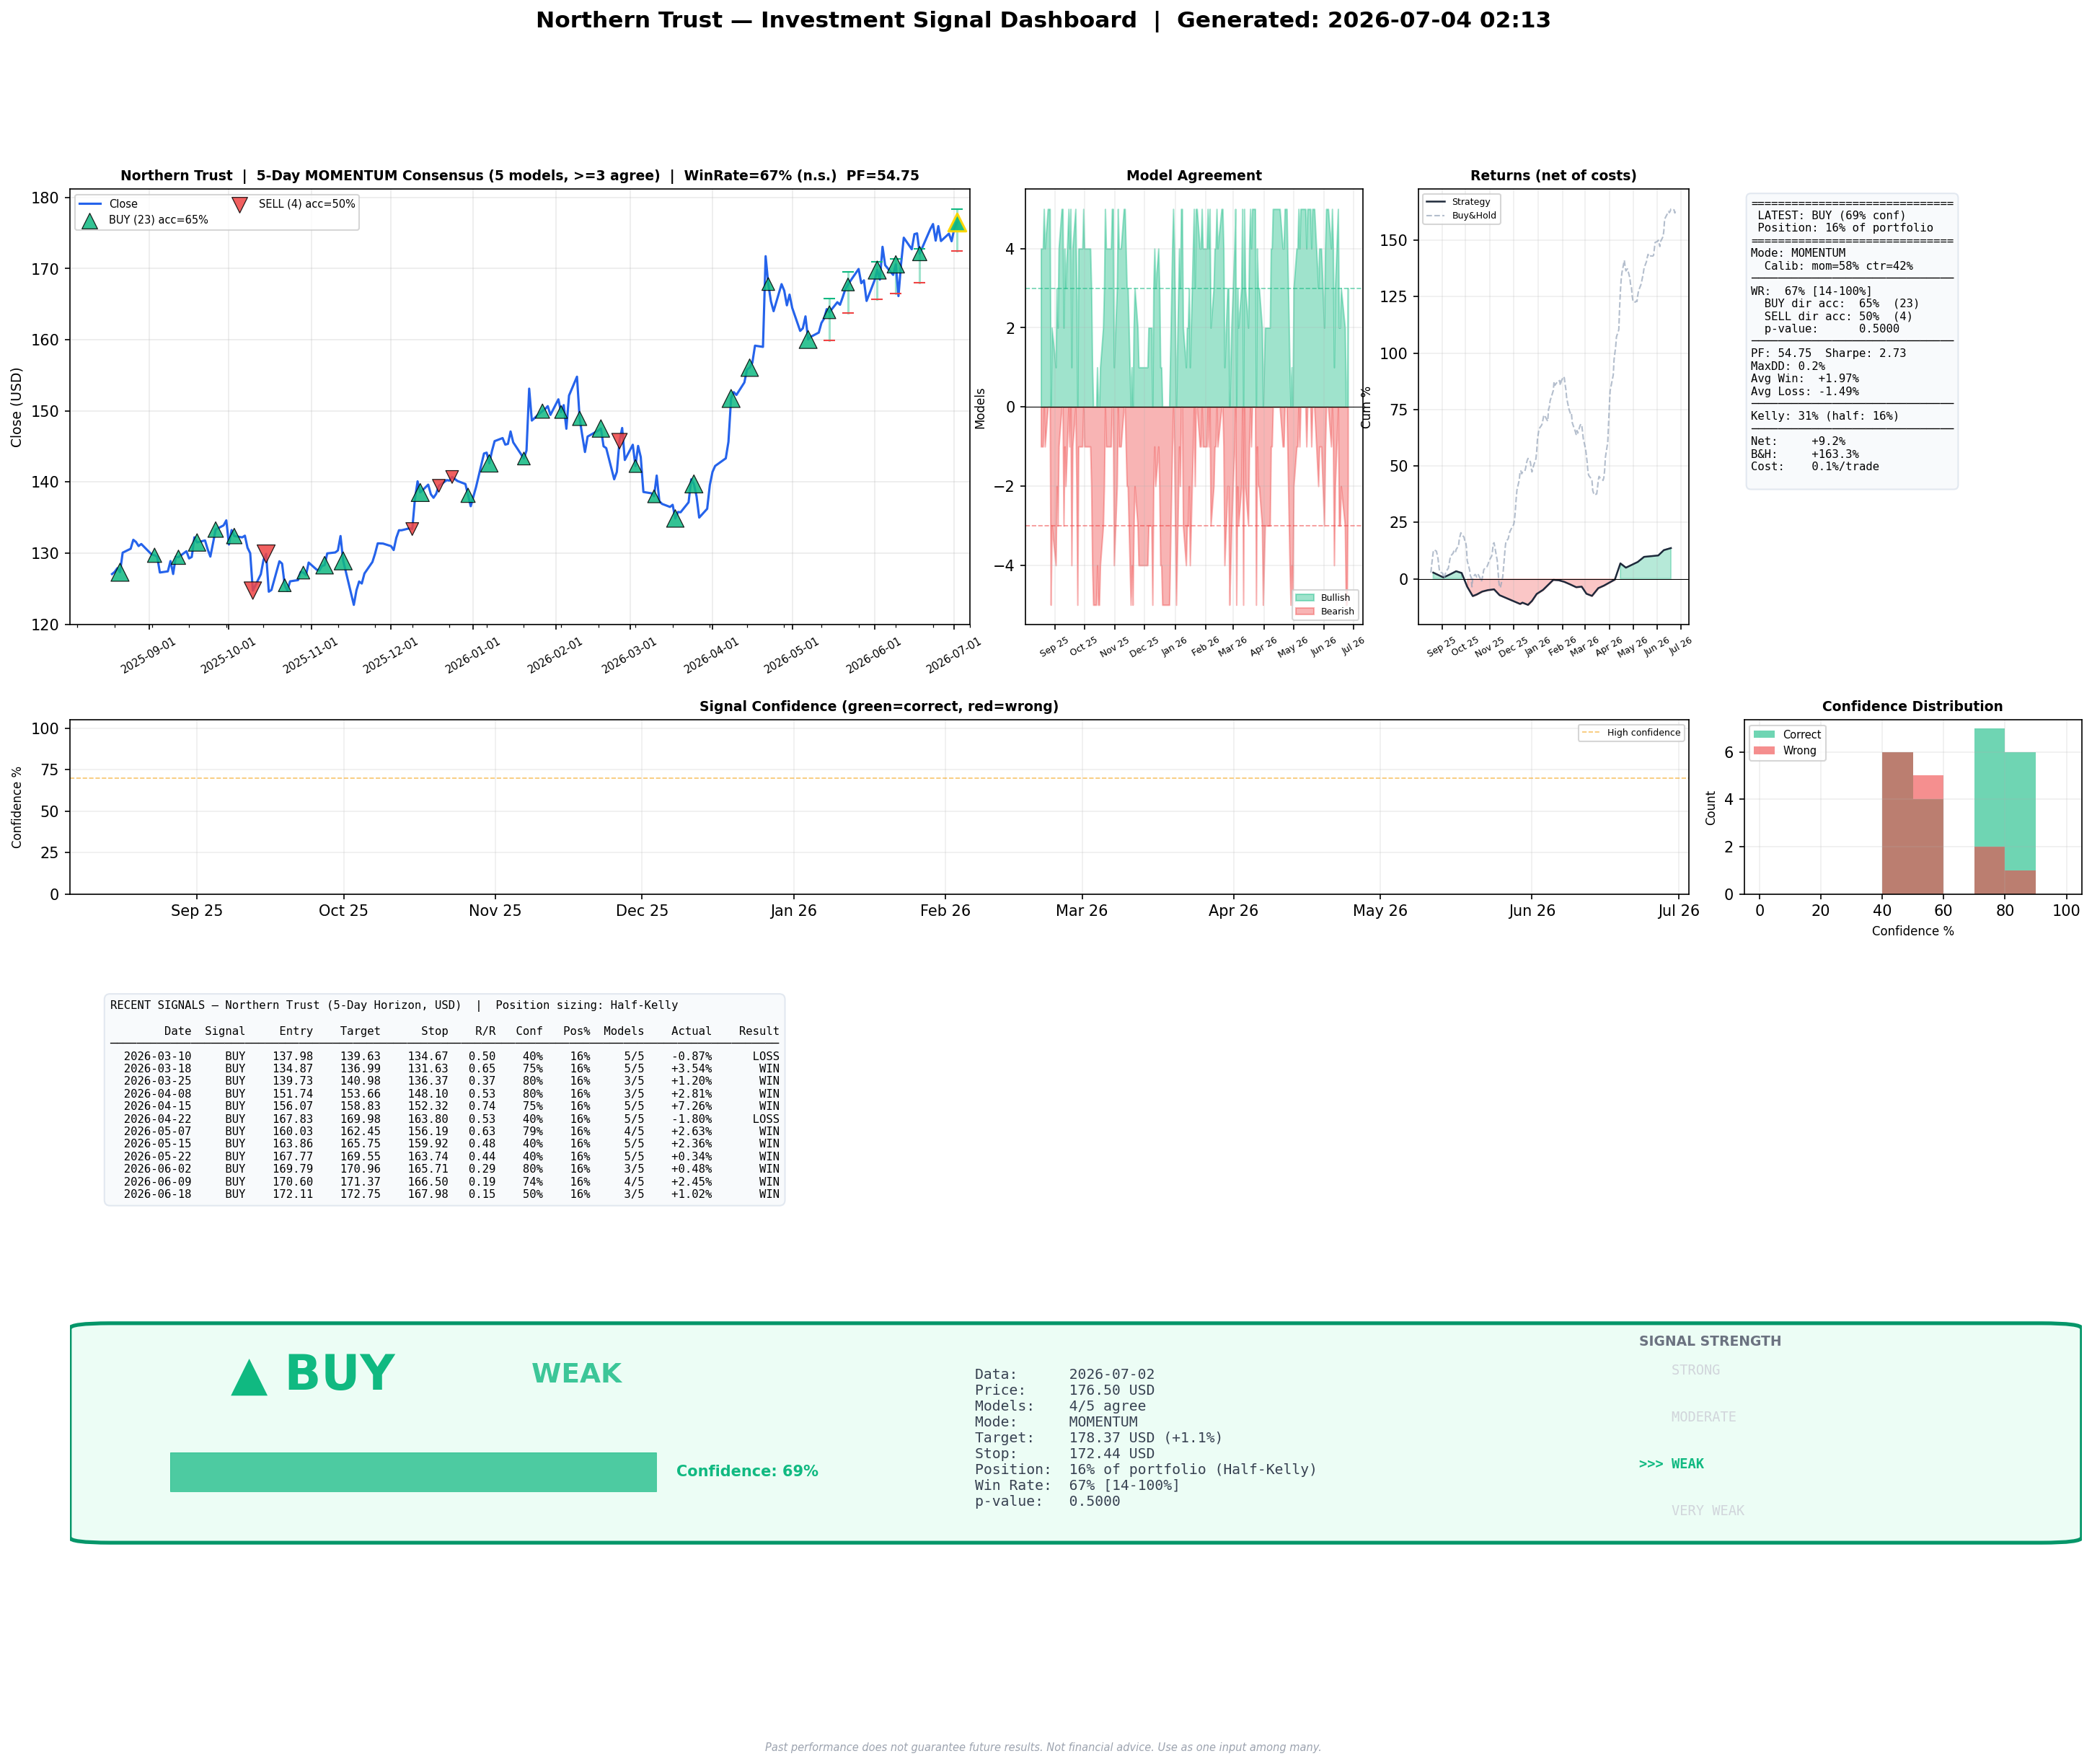
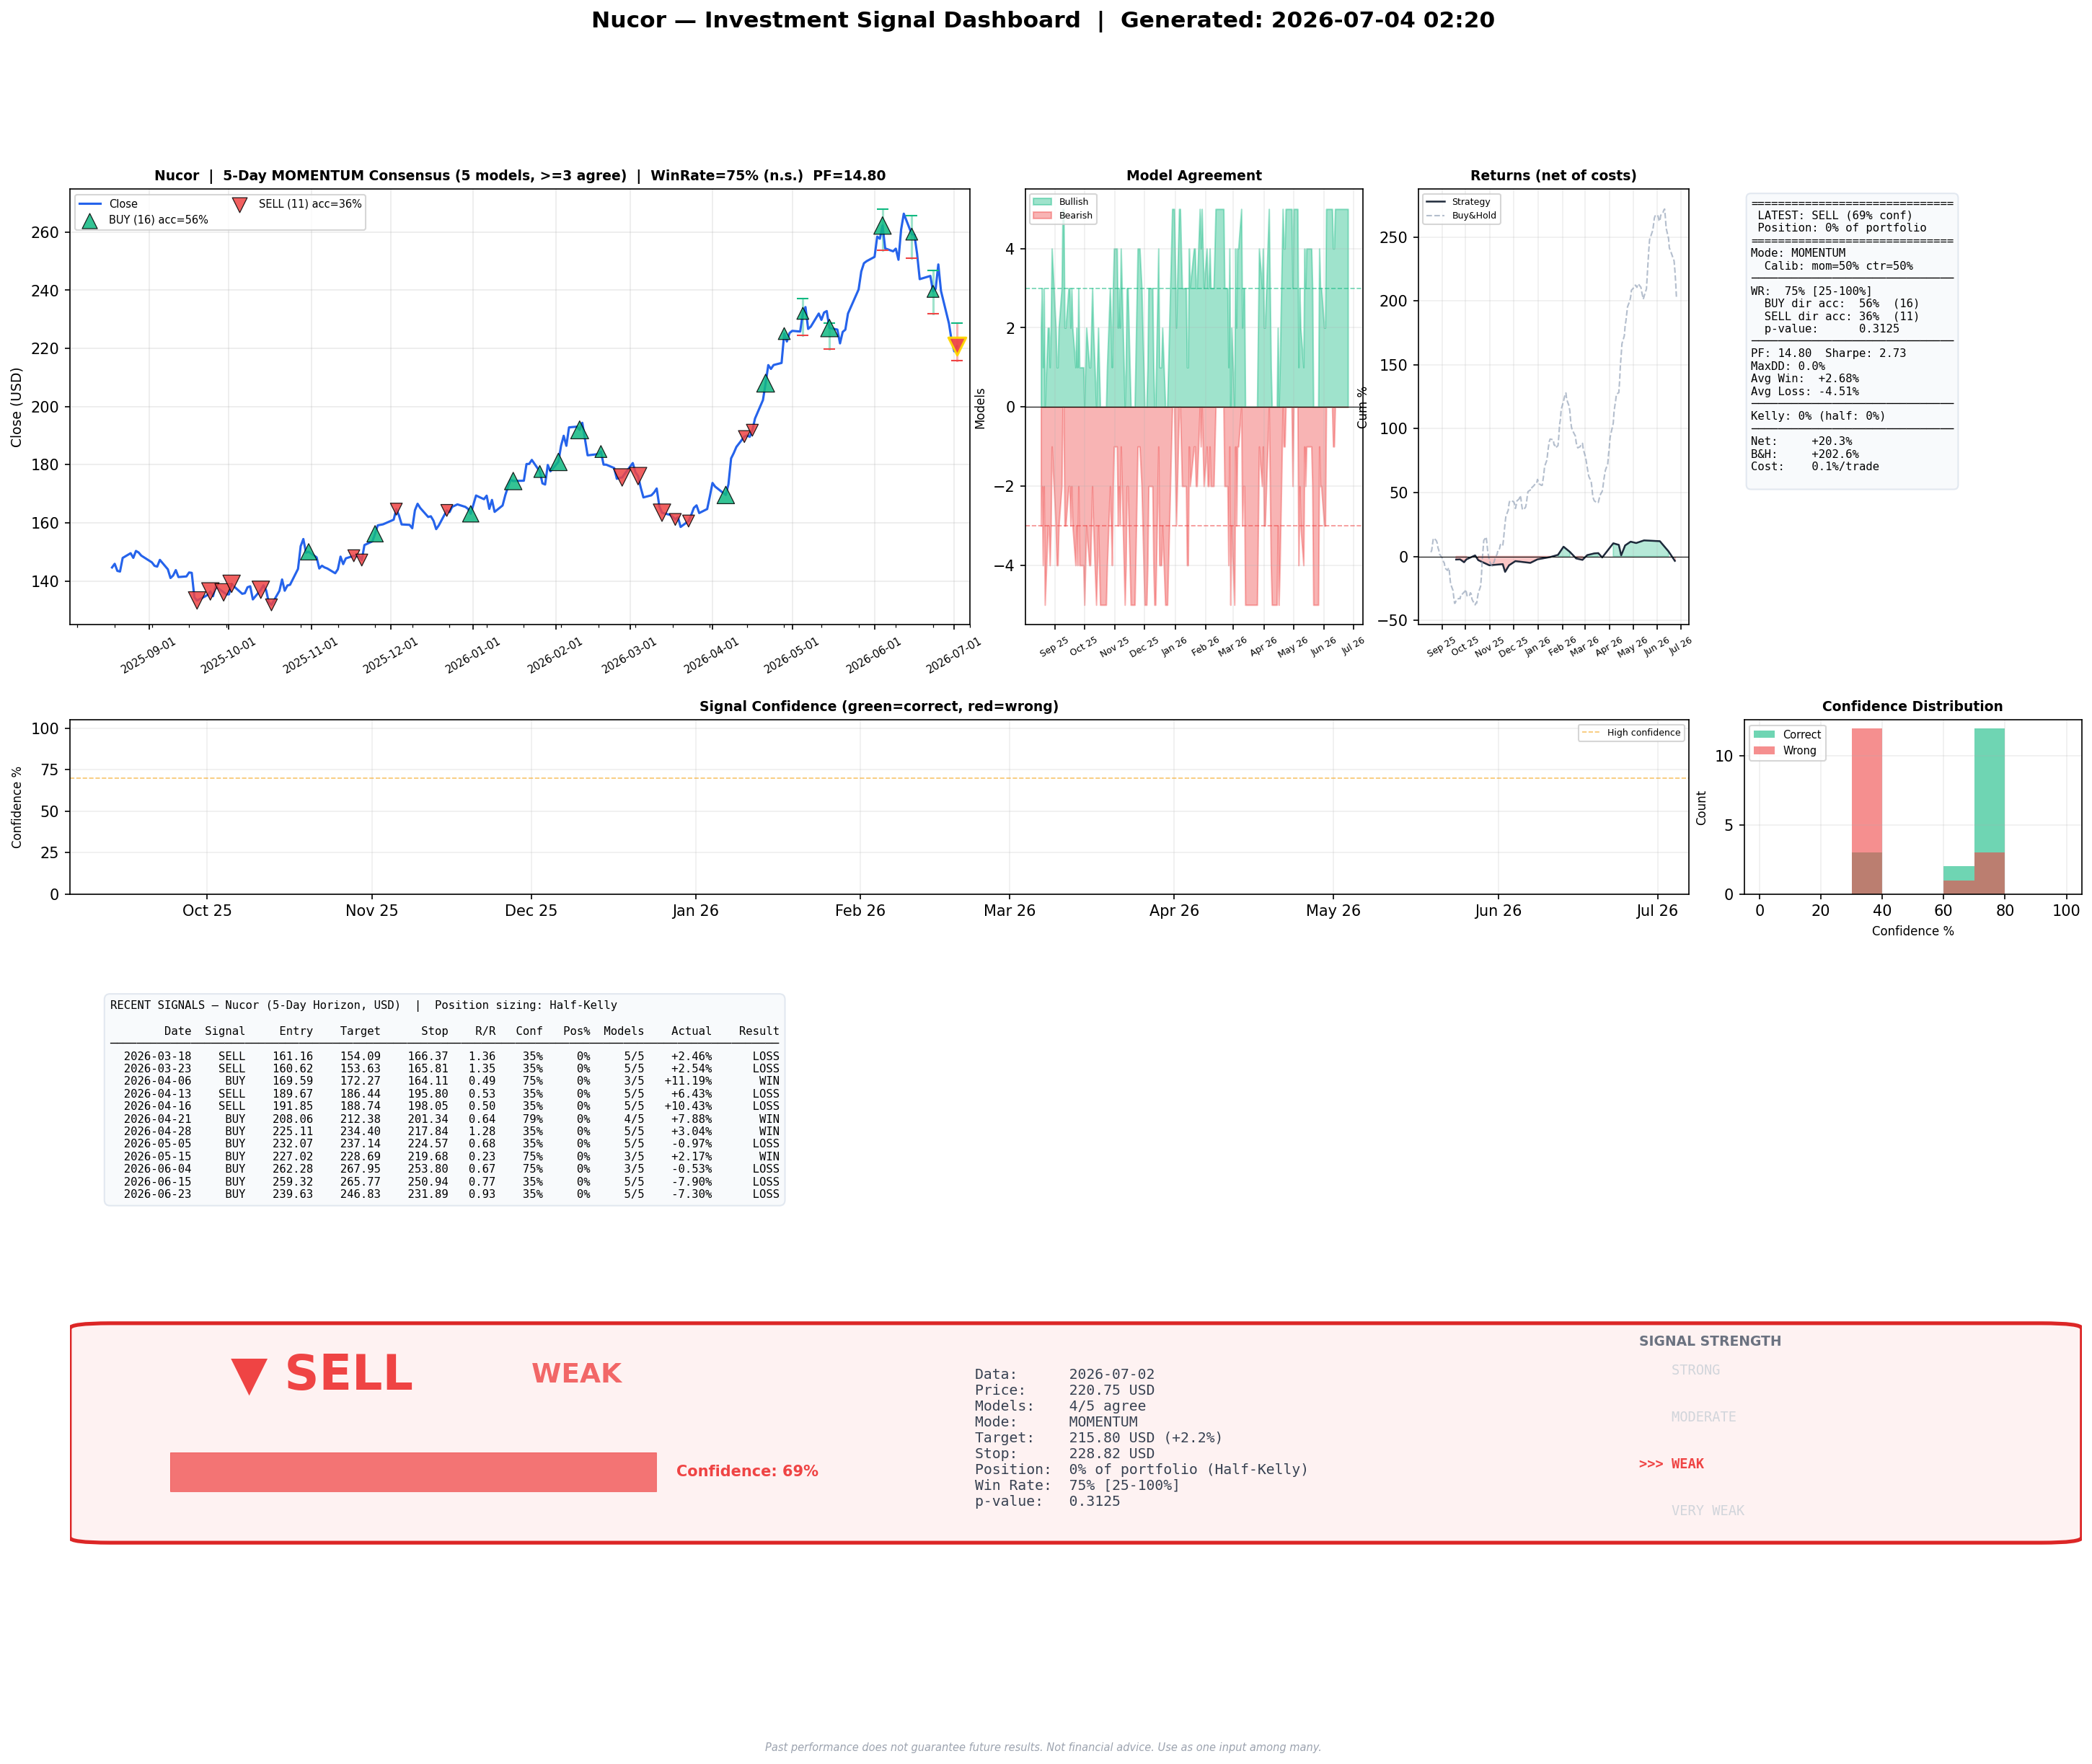
| Ticker | Signal | Strength | Confidence | Position | Target | Stop | Accuracy | Sharpe | Mode | Chart |
|---|---|---|---|---|---|---|---|---|---|---|
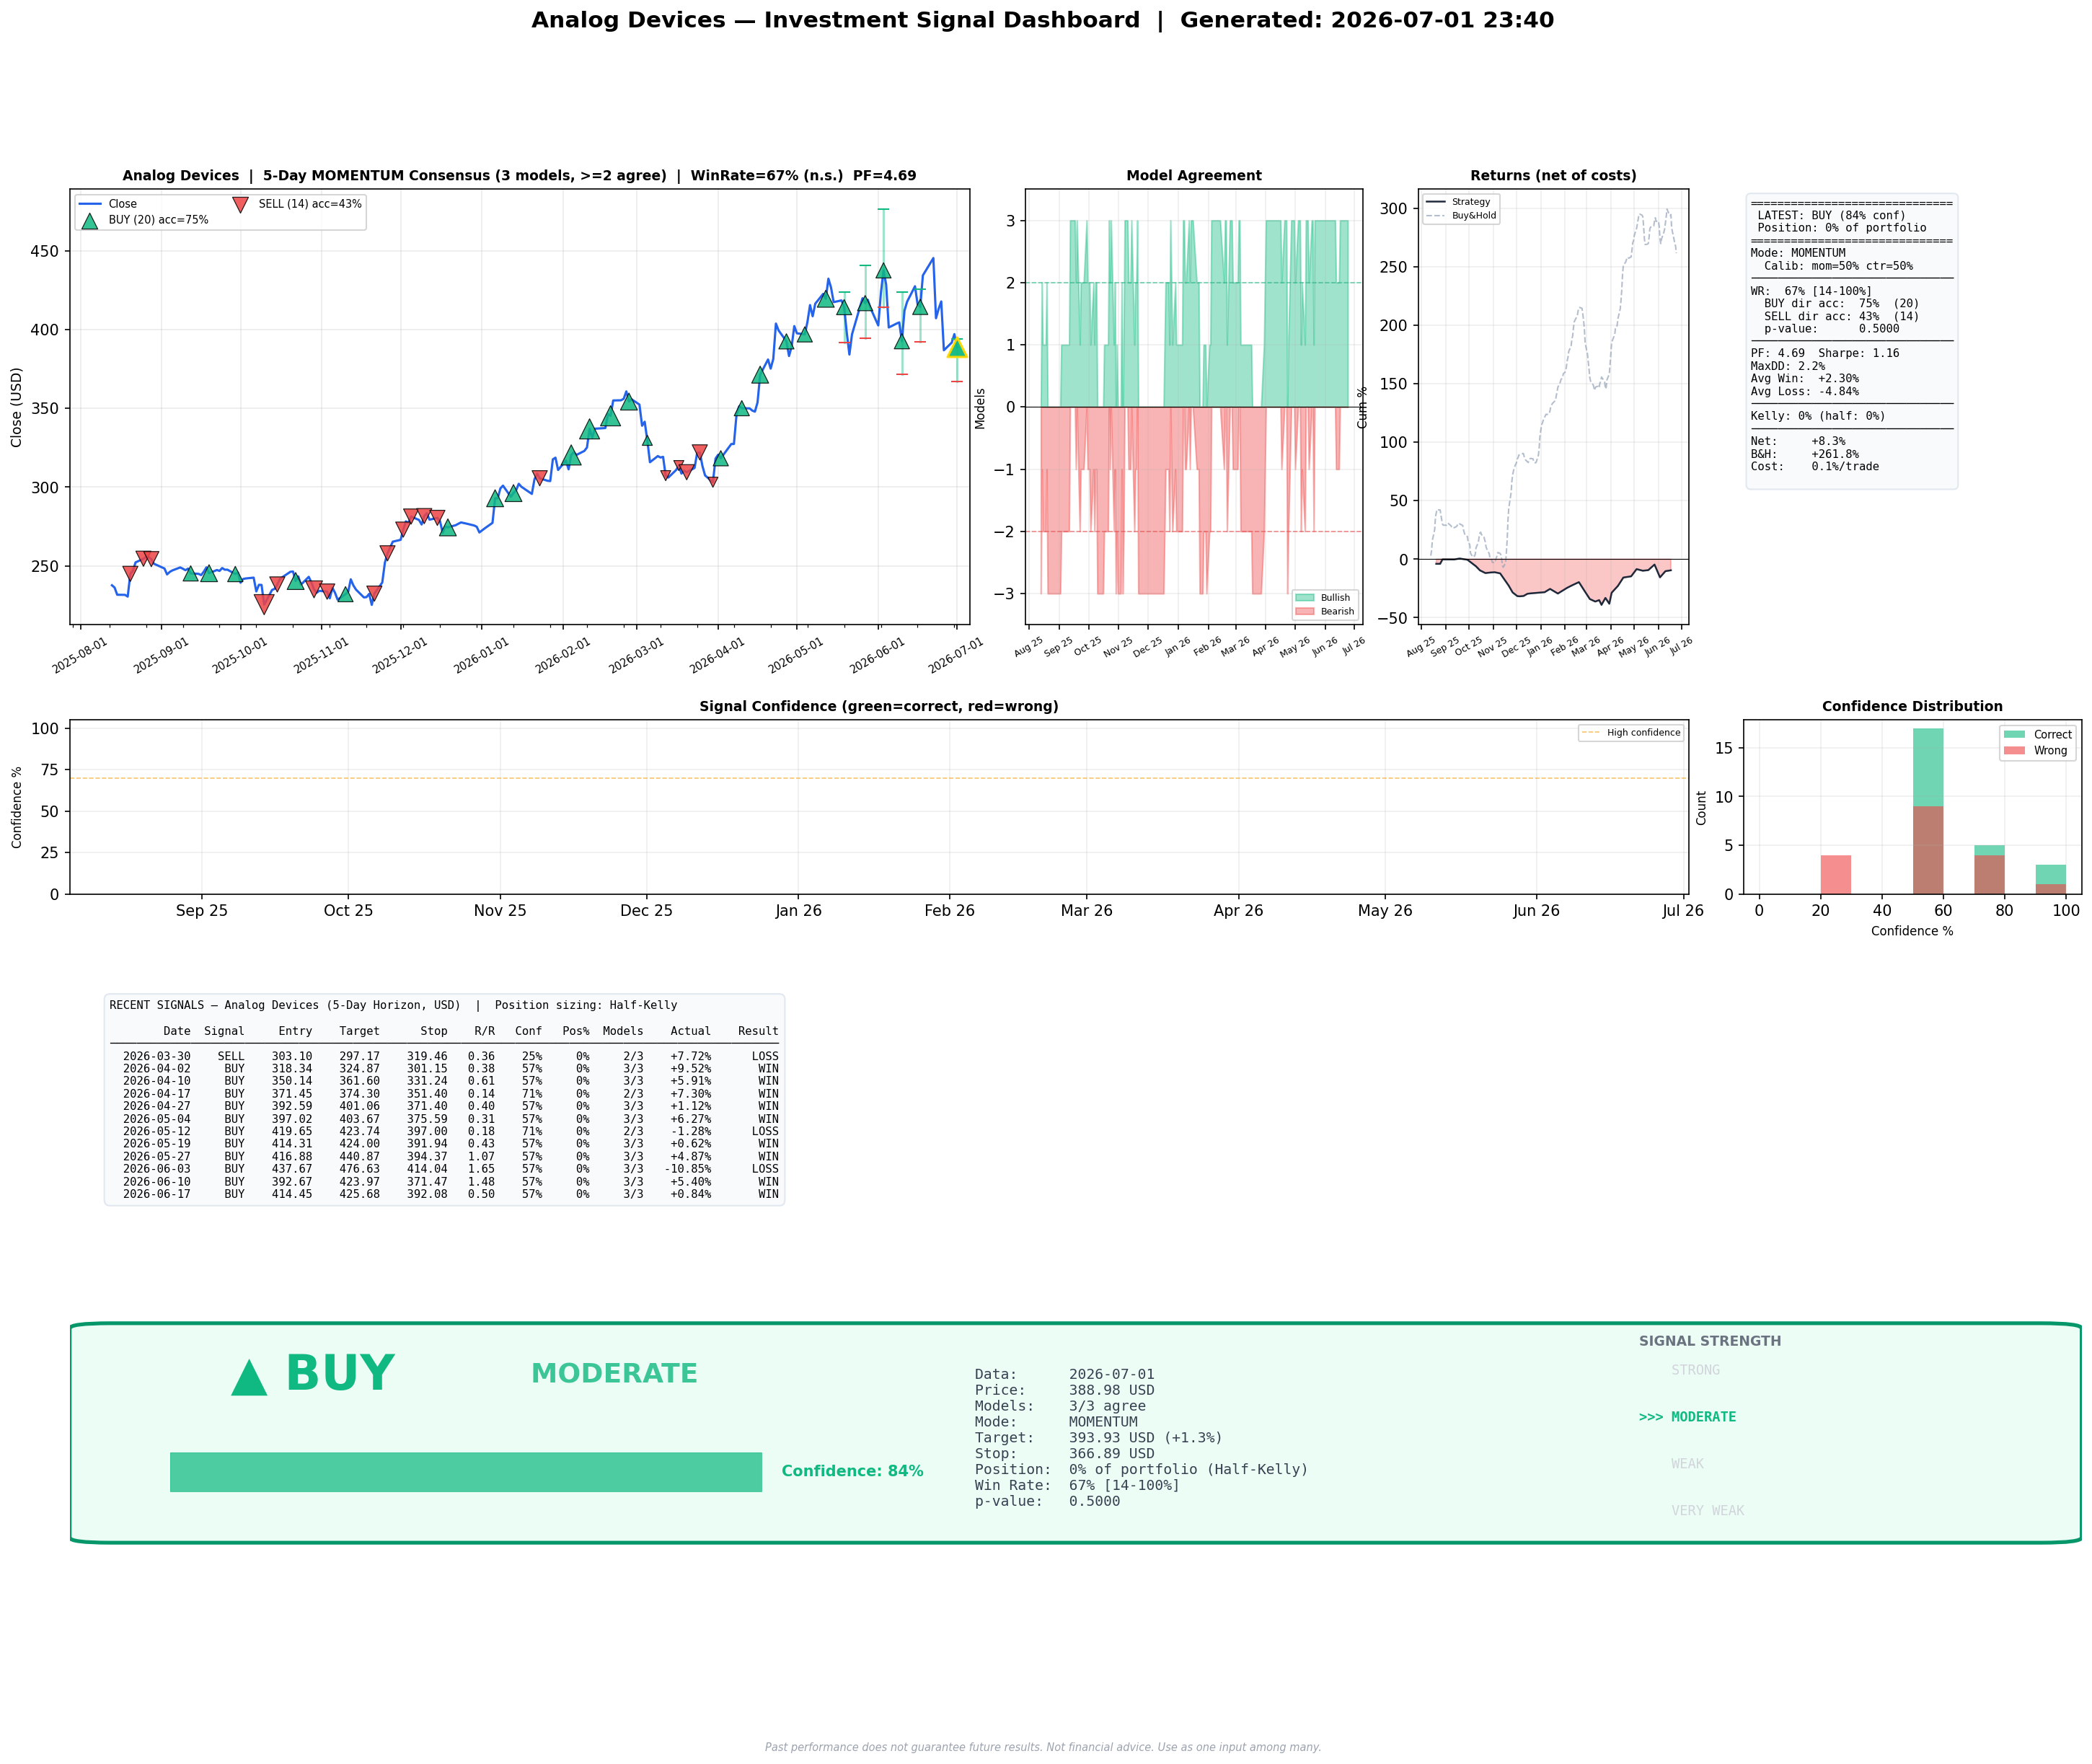
| ADI | BUY | WEAK | 69% | 69% | 394.15 | 363.86 | 67% | 1.06 | momentum | Chart |
| AKAM | BUY | WEAK | 69% | 69% | 114.71 | 107.83 | 75% | 2.91 | momentum | Chart |
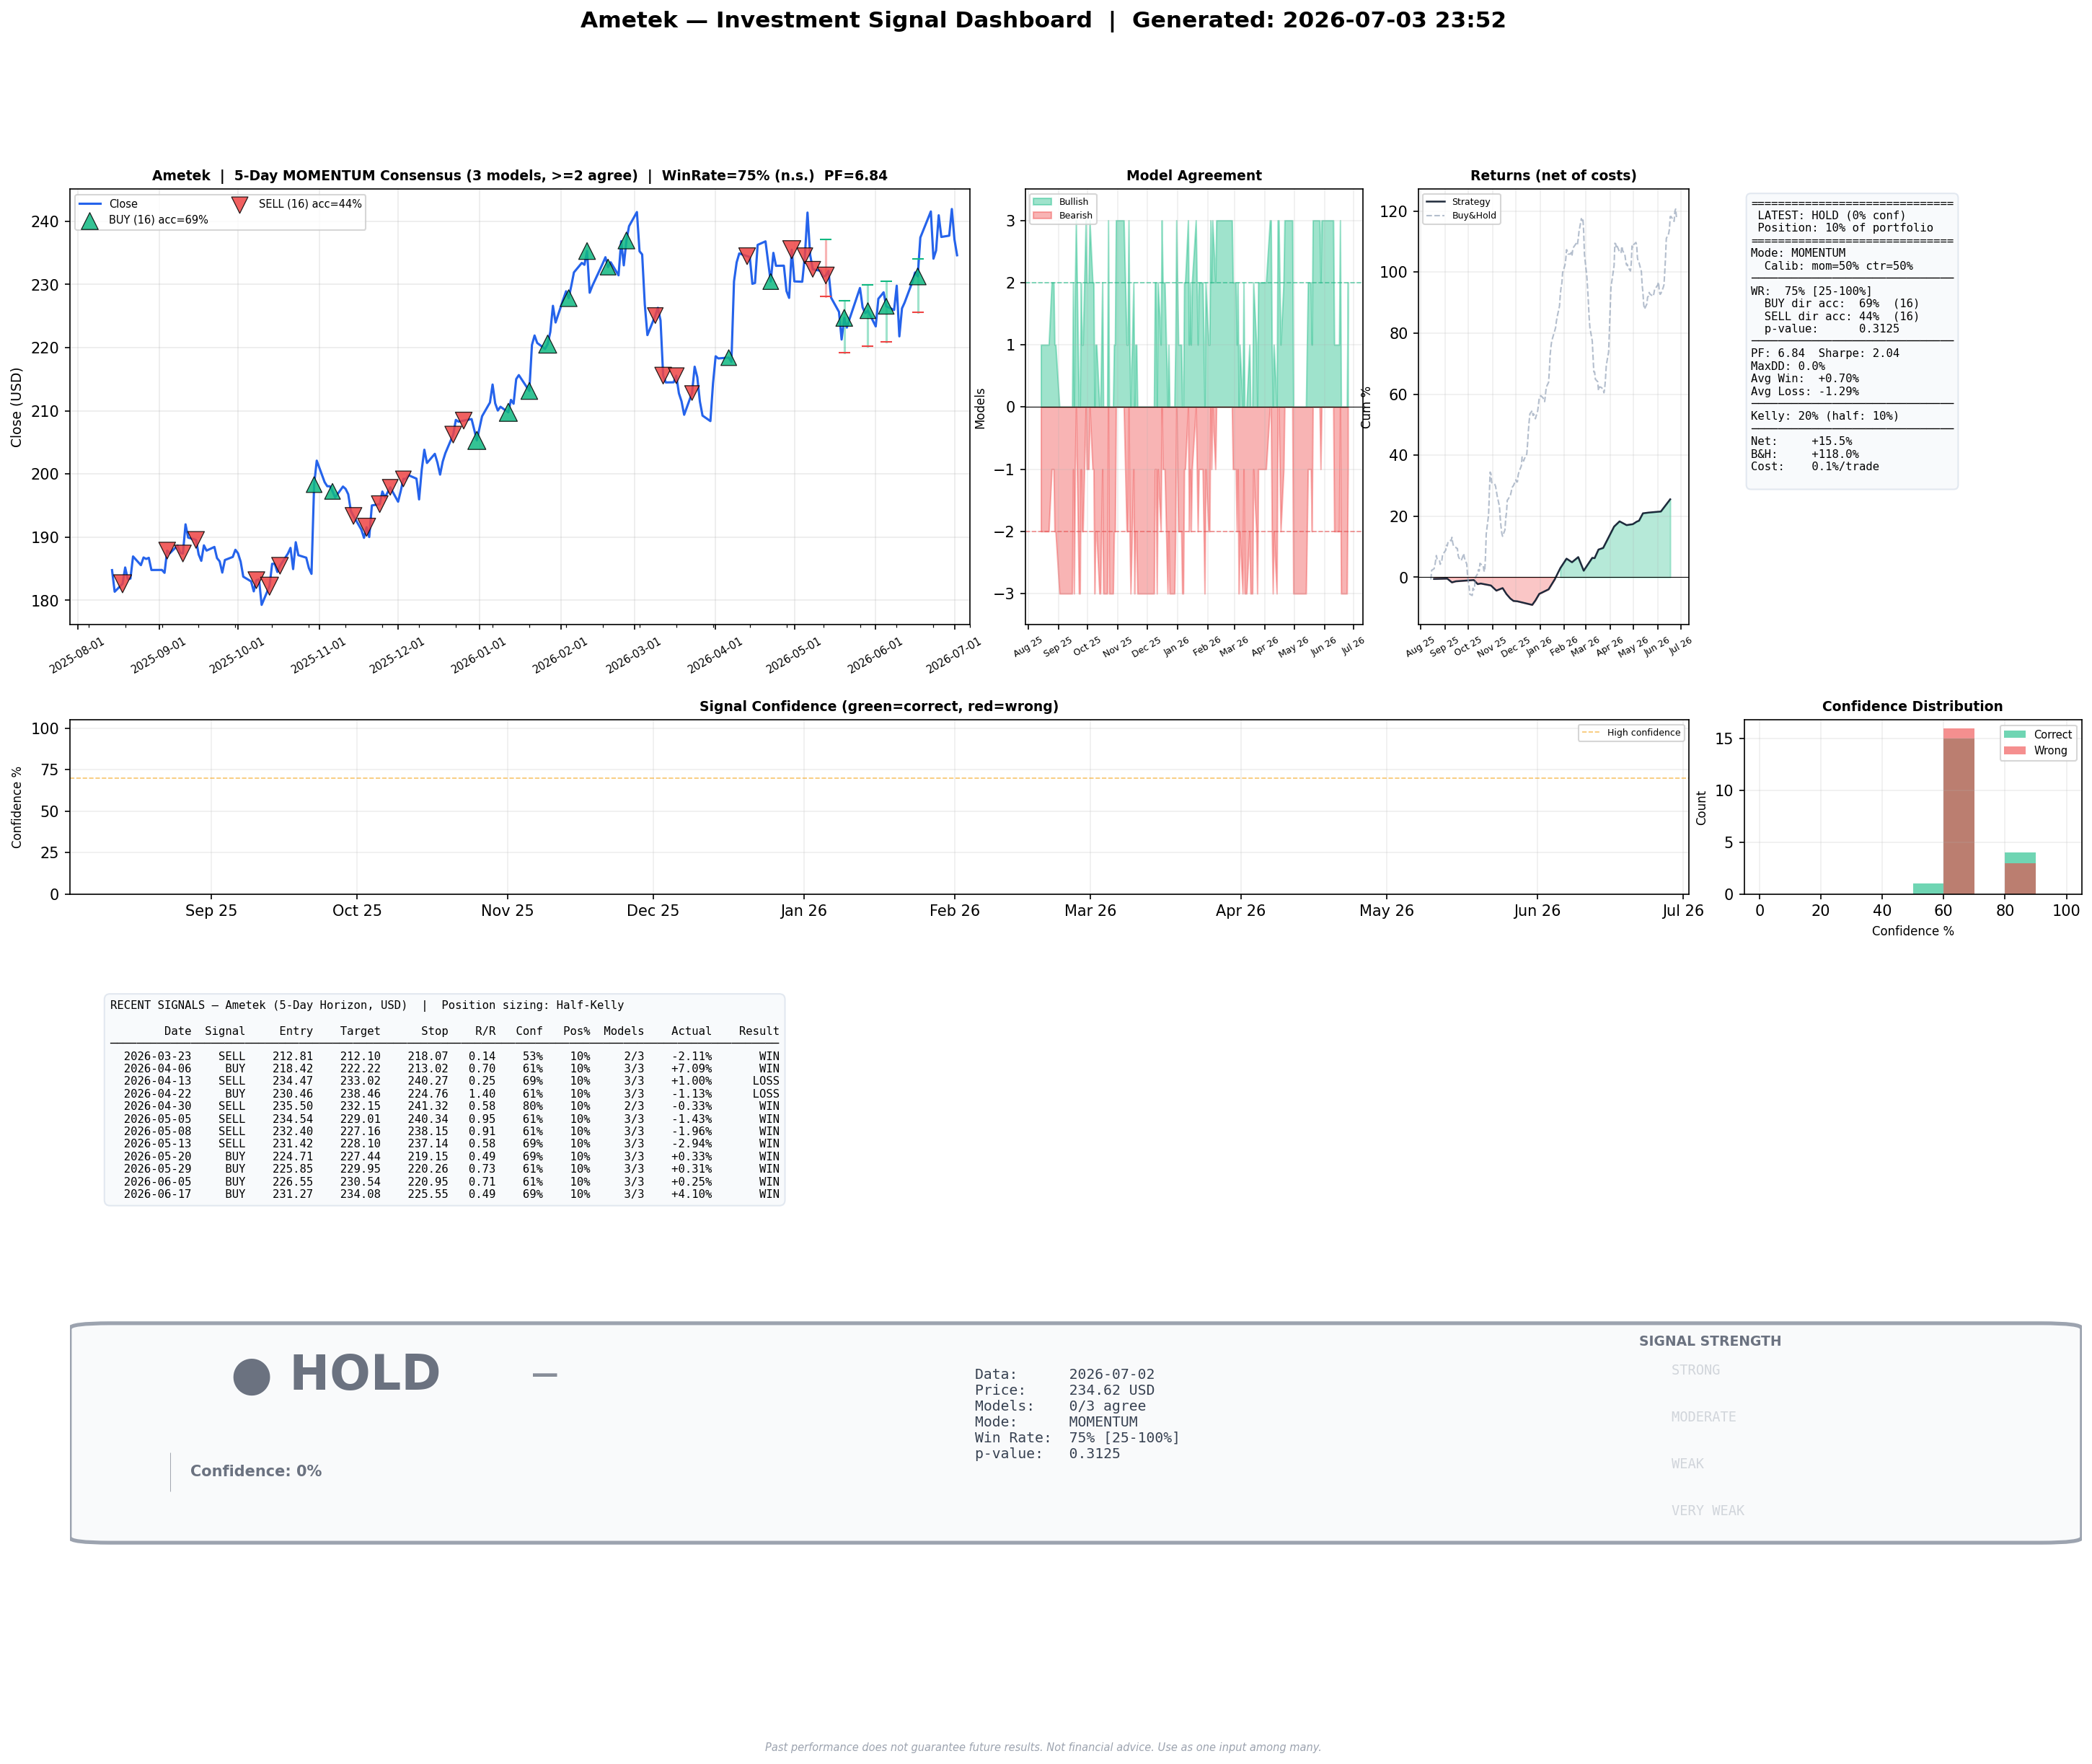
| AME | BUY | MODERATE | 84% | 111% | 239.95 | 231.51 | 67% | 0.93 | contrarian | Chart |
| CAT | BUY | WEAK | 69% | 69% | 1013.05 | 946.39 | 0% | — | 0.00 | Chart |
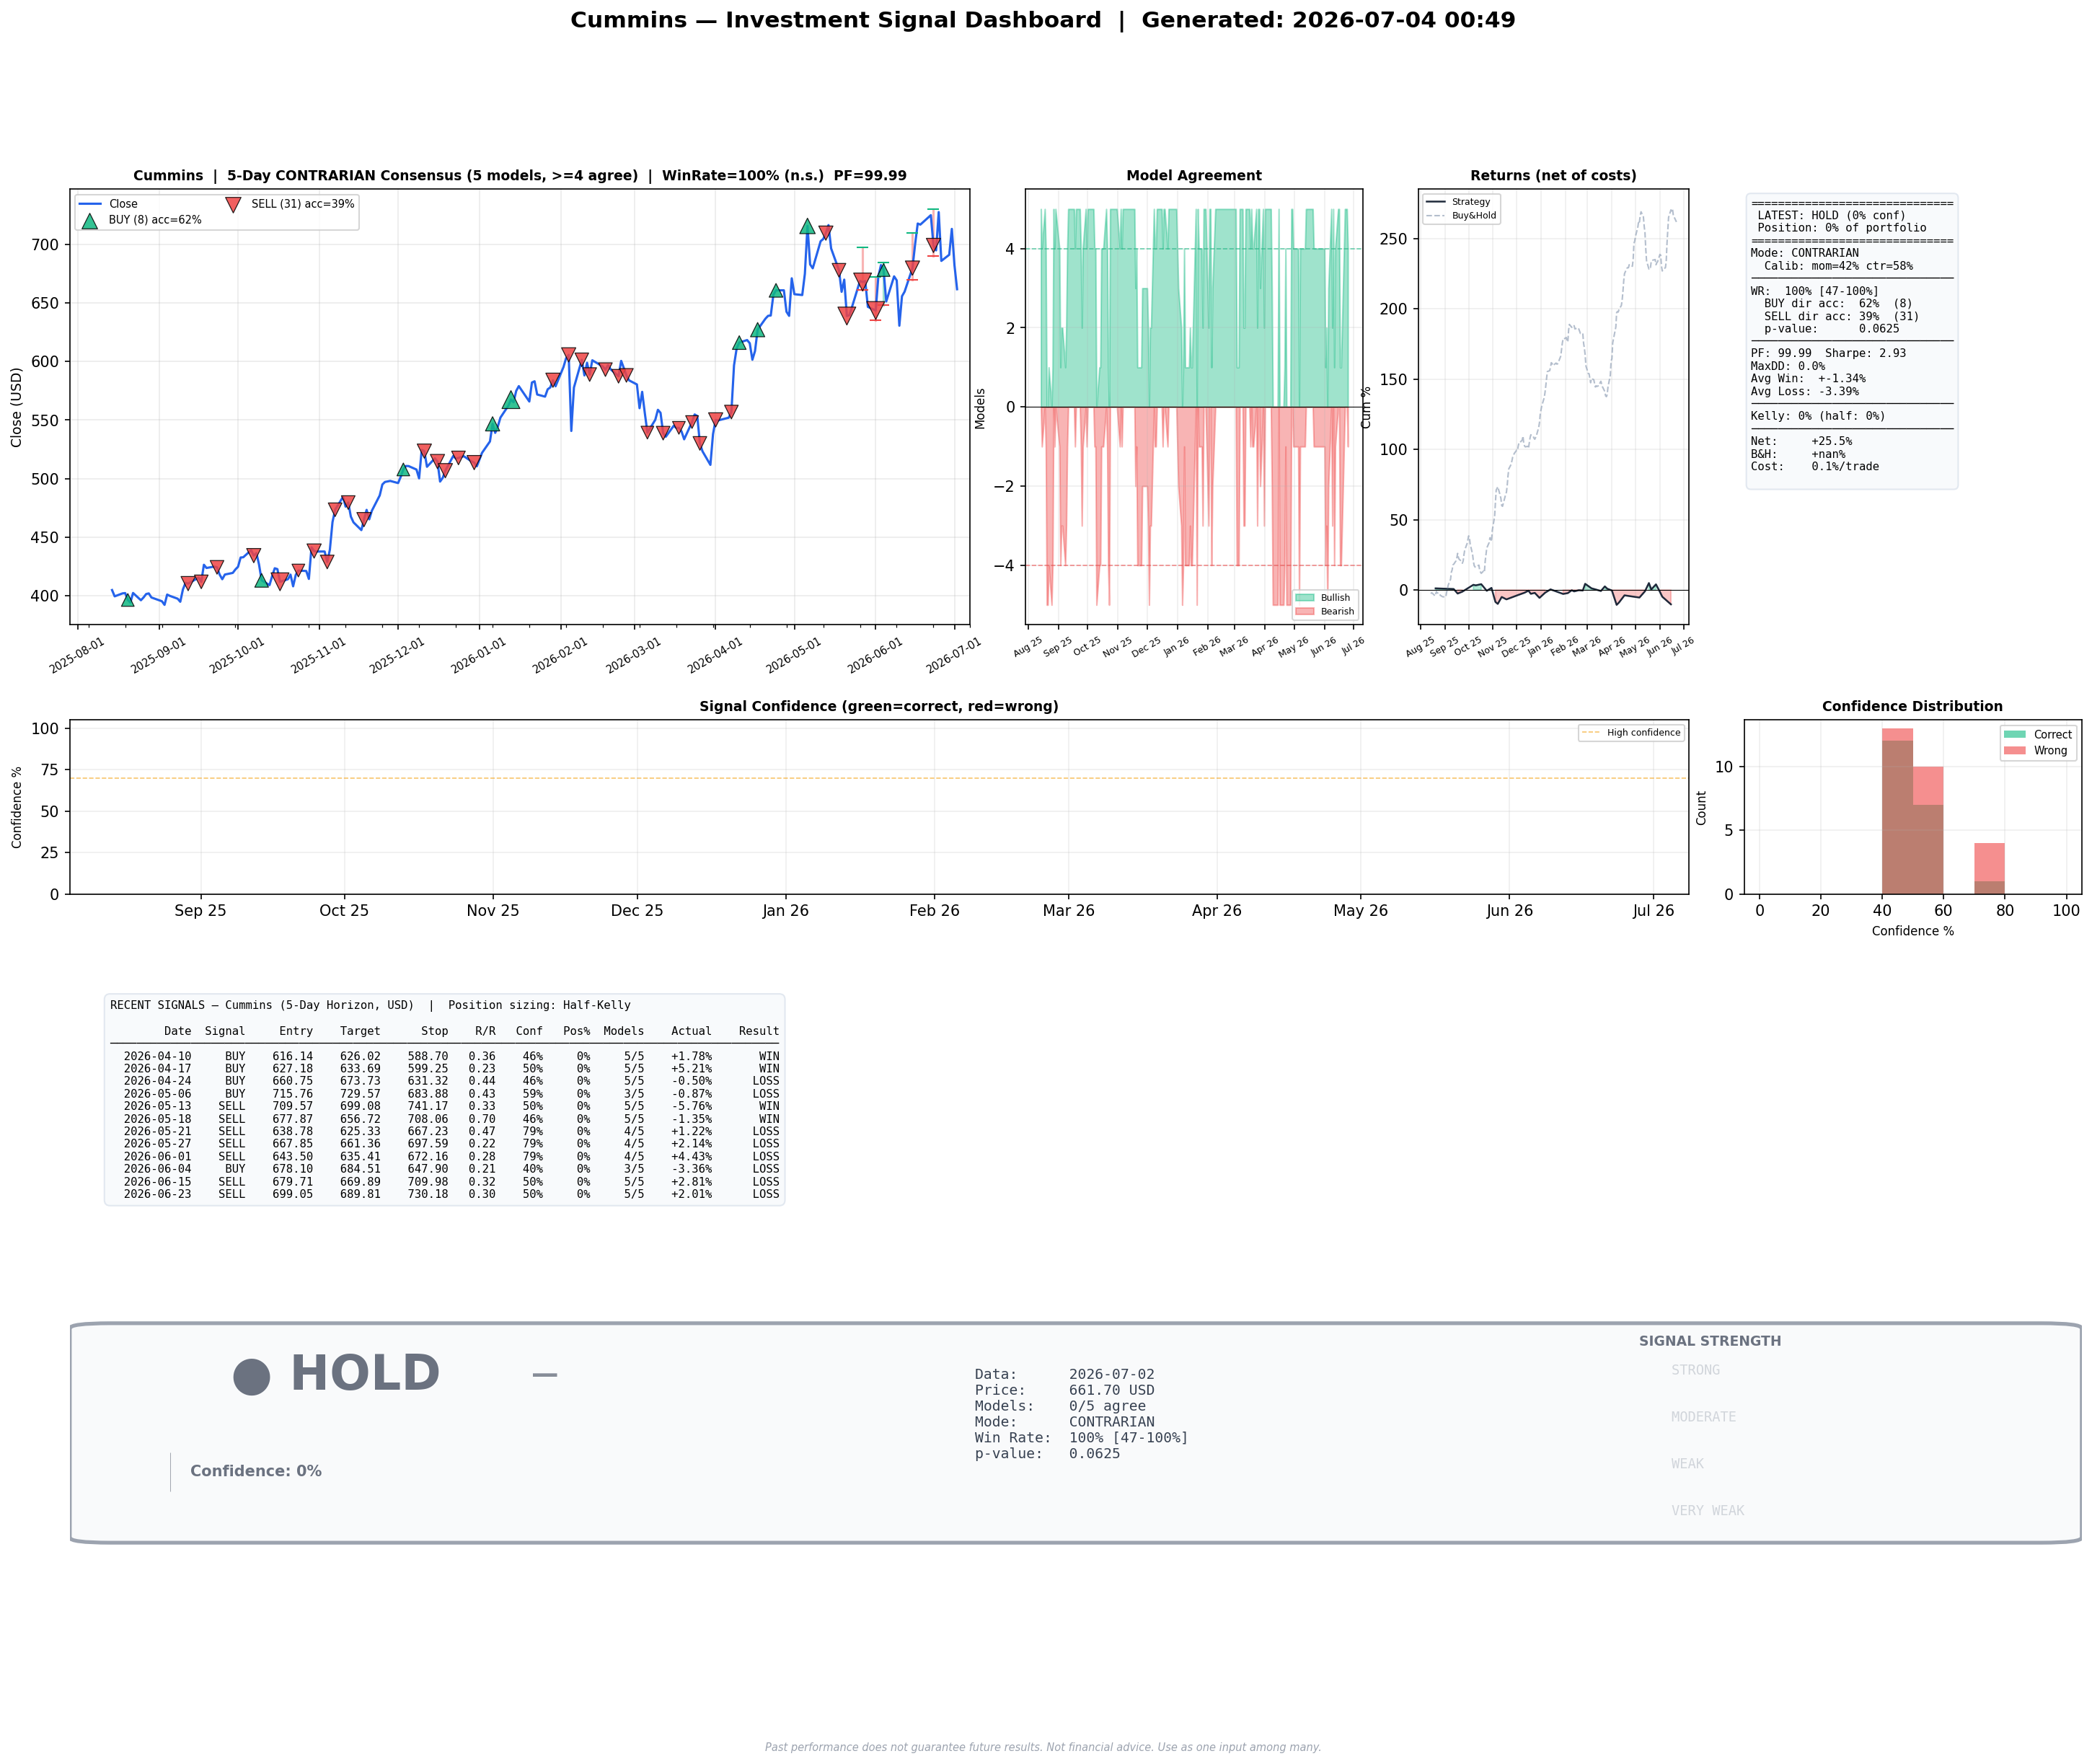
| CMI | BUY | MODERATE | 84% | 111% | 702.34 | 652.15 | 100% | 5.00 | momentum | Chart |
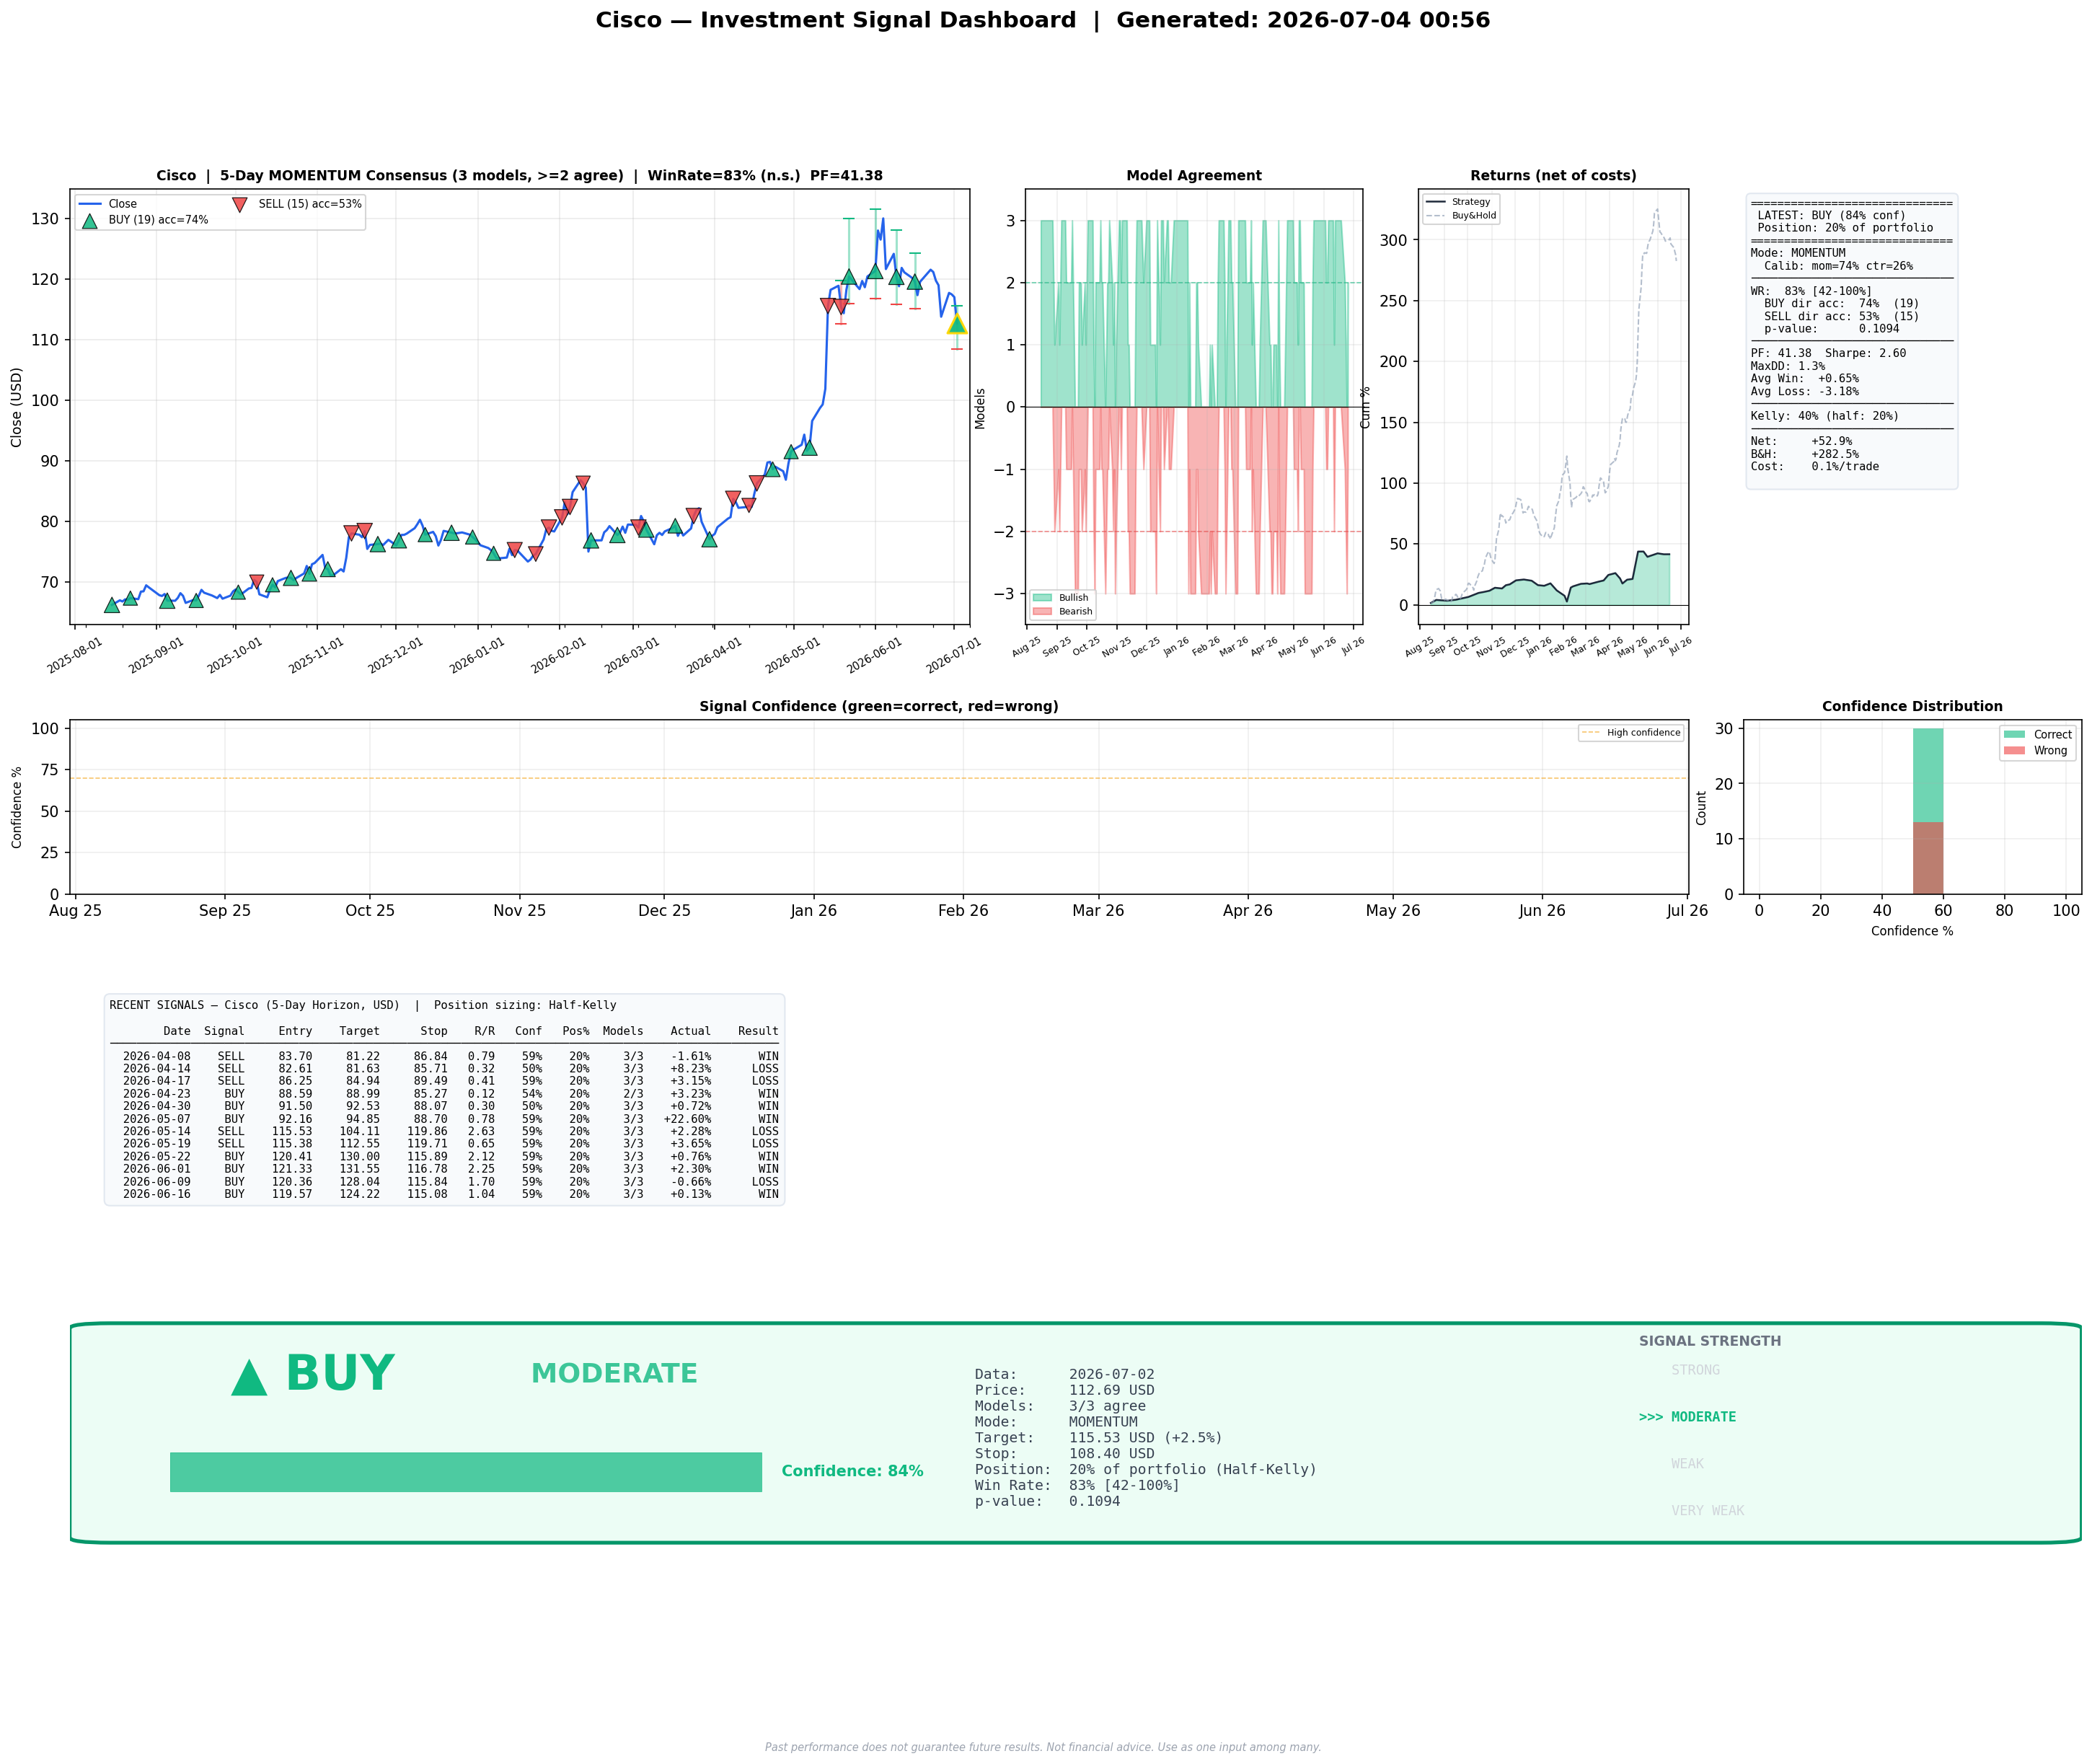
| CSCO | BUY | WEAK | 69% | 69% | 115.17 | 109.19 | 100% | 2.62 | momentum | Chart |
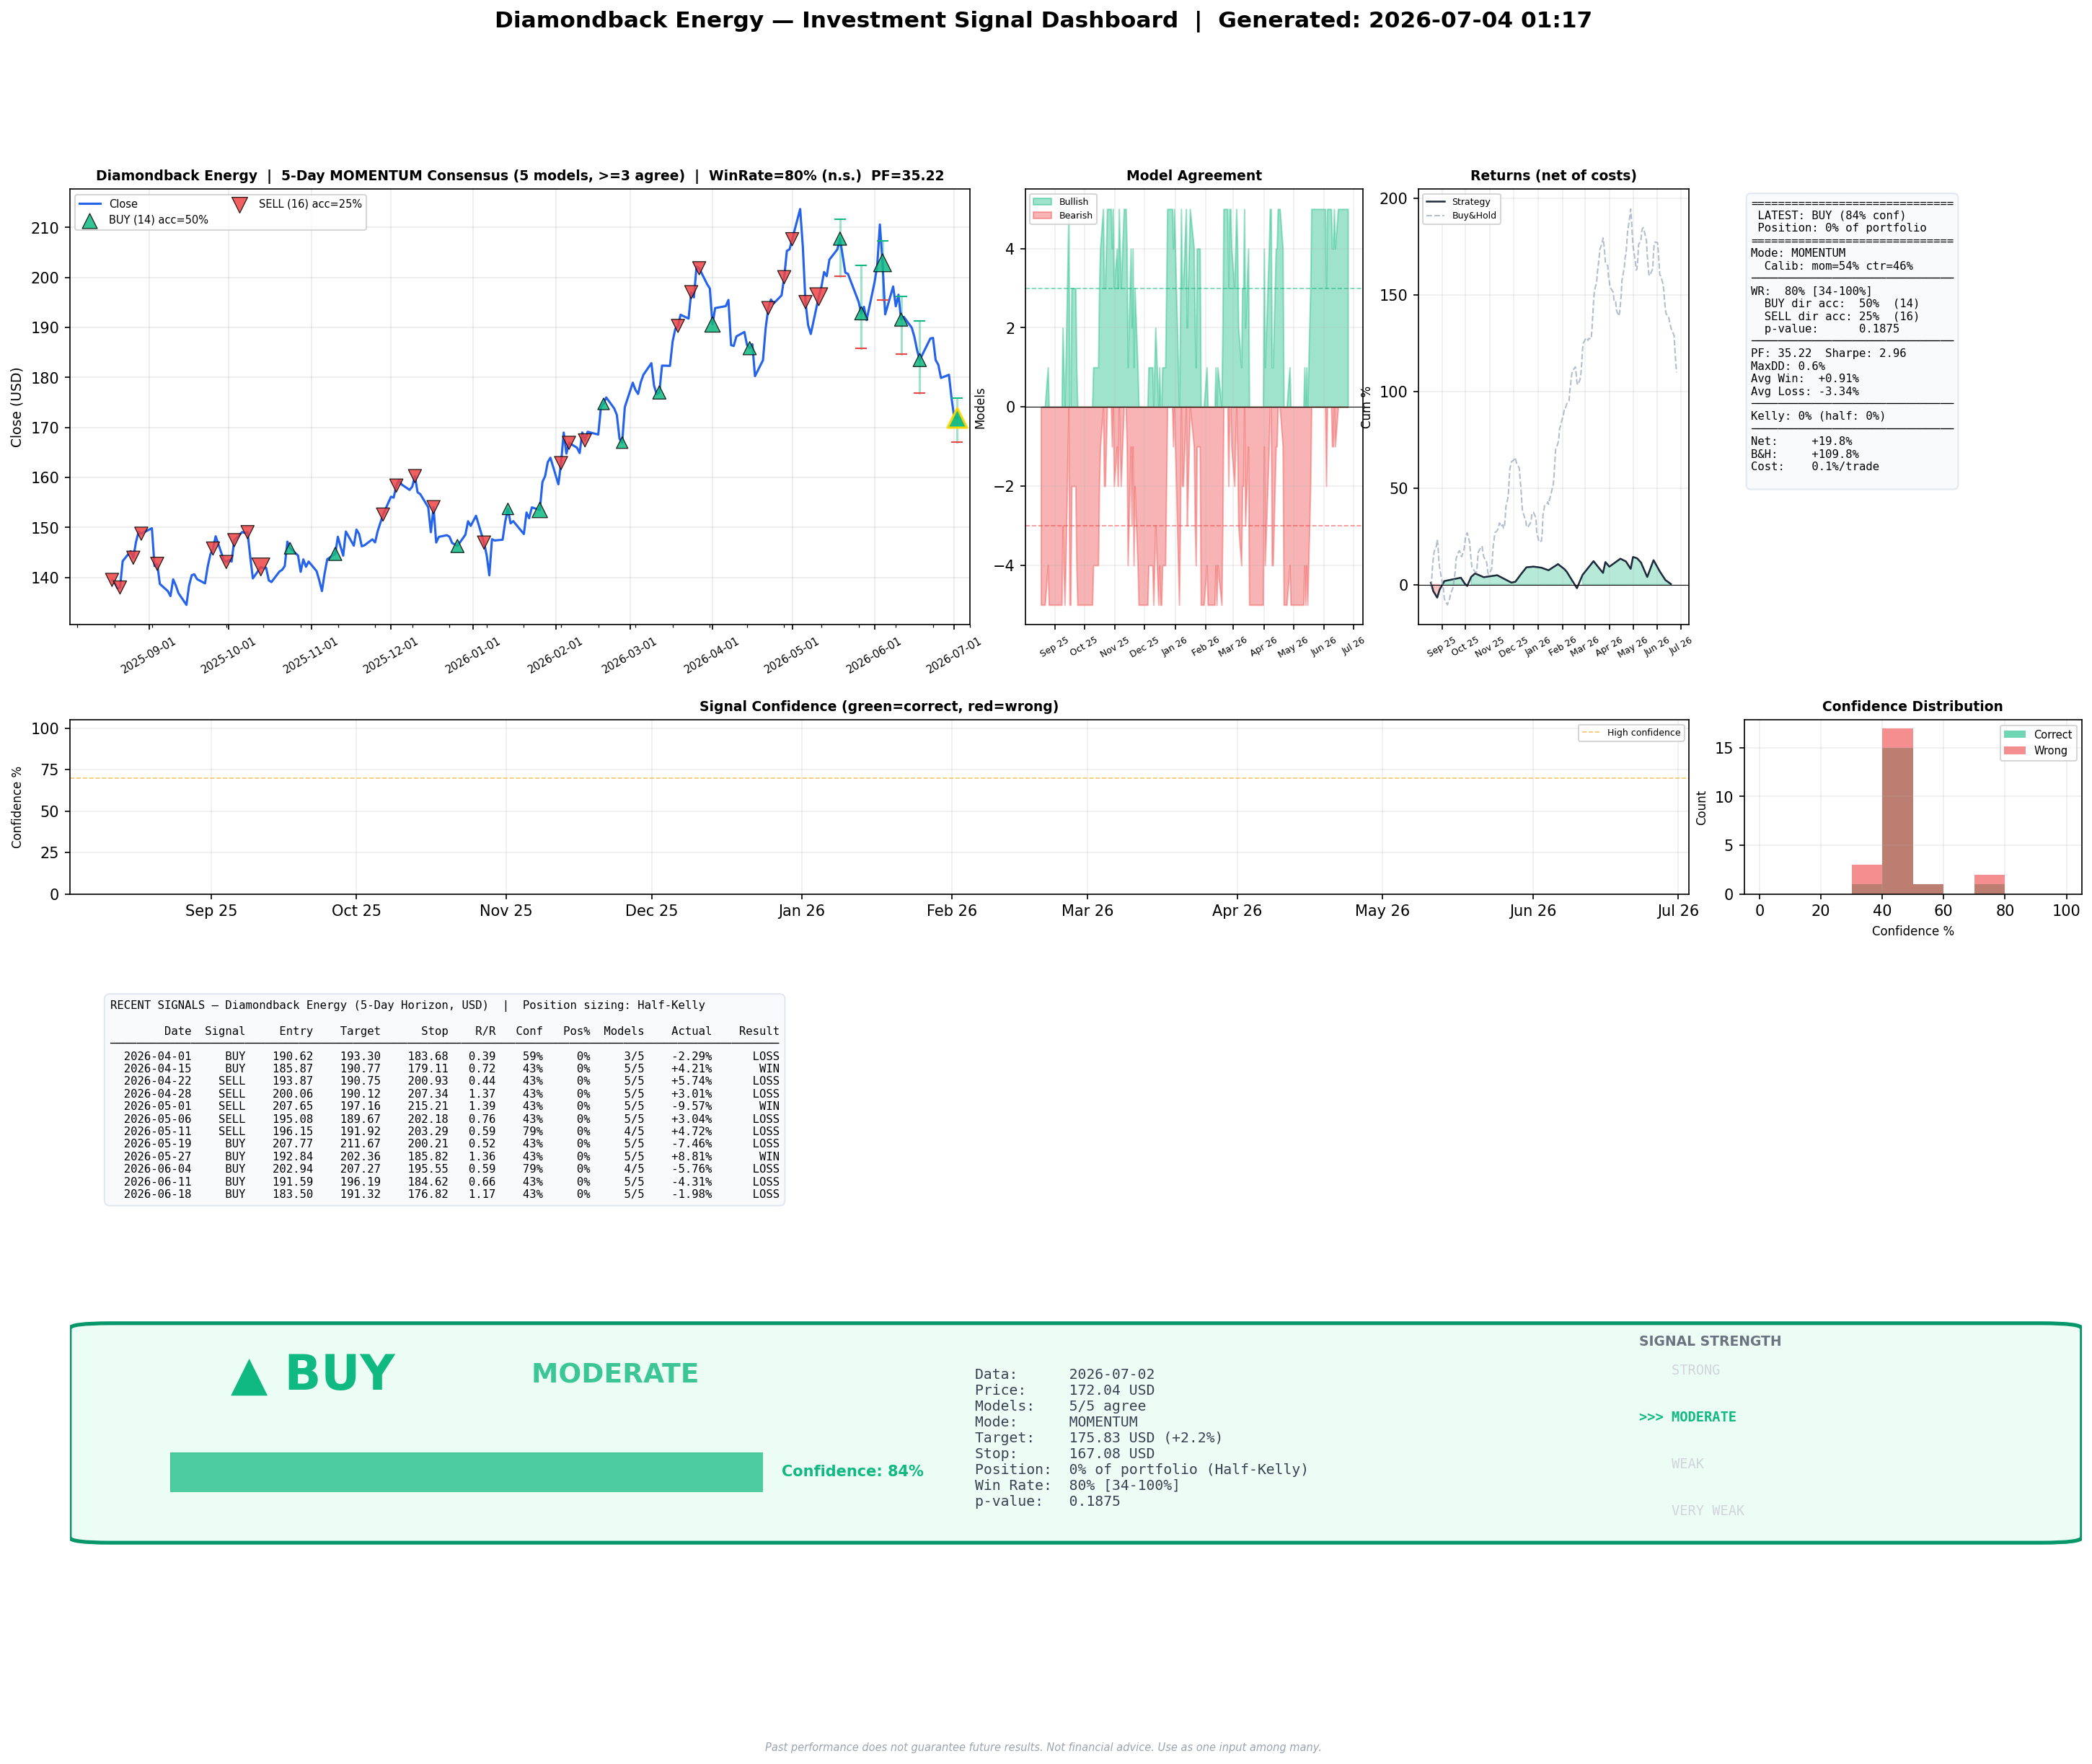
| FANG | BUY | WEAK | 63% | 52% | 180.58 | 173.34 | 75% | 2.48 | momentum | Chart |
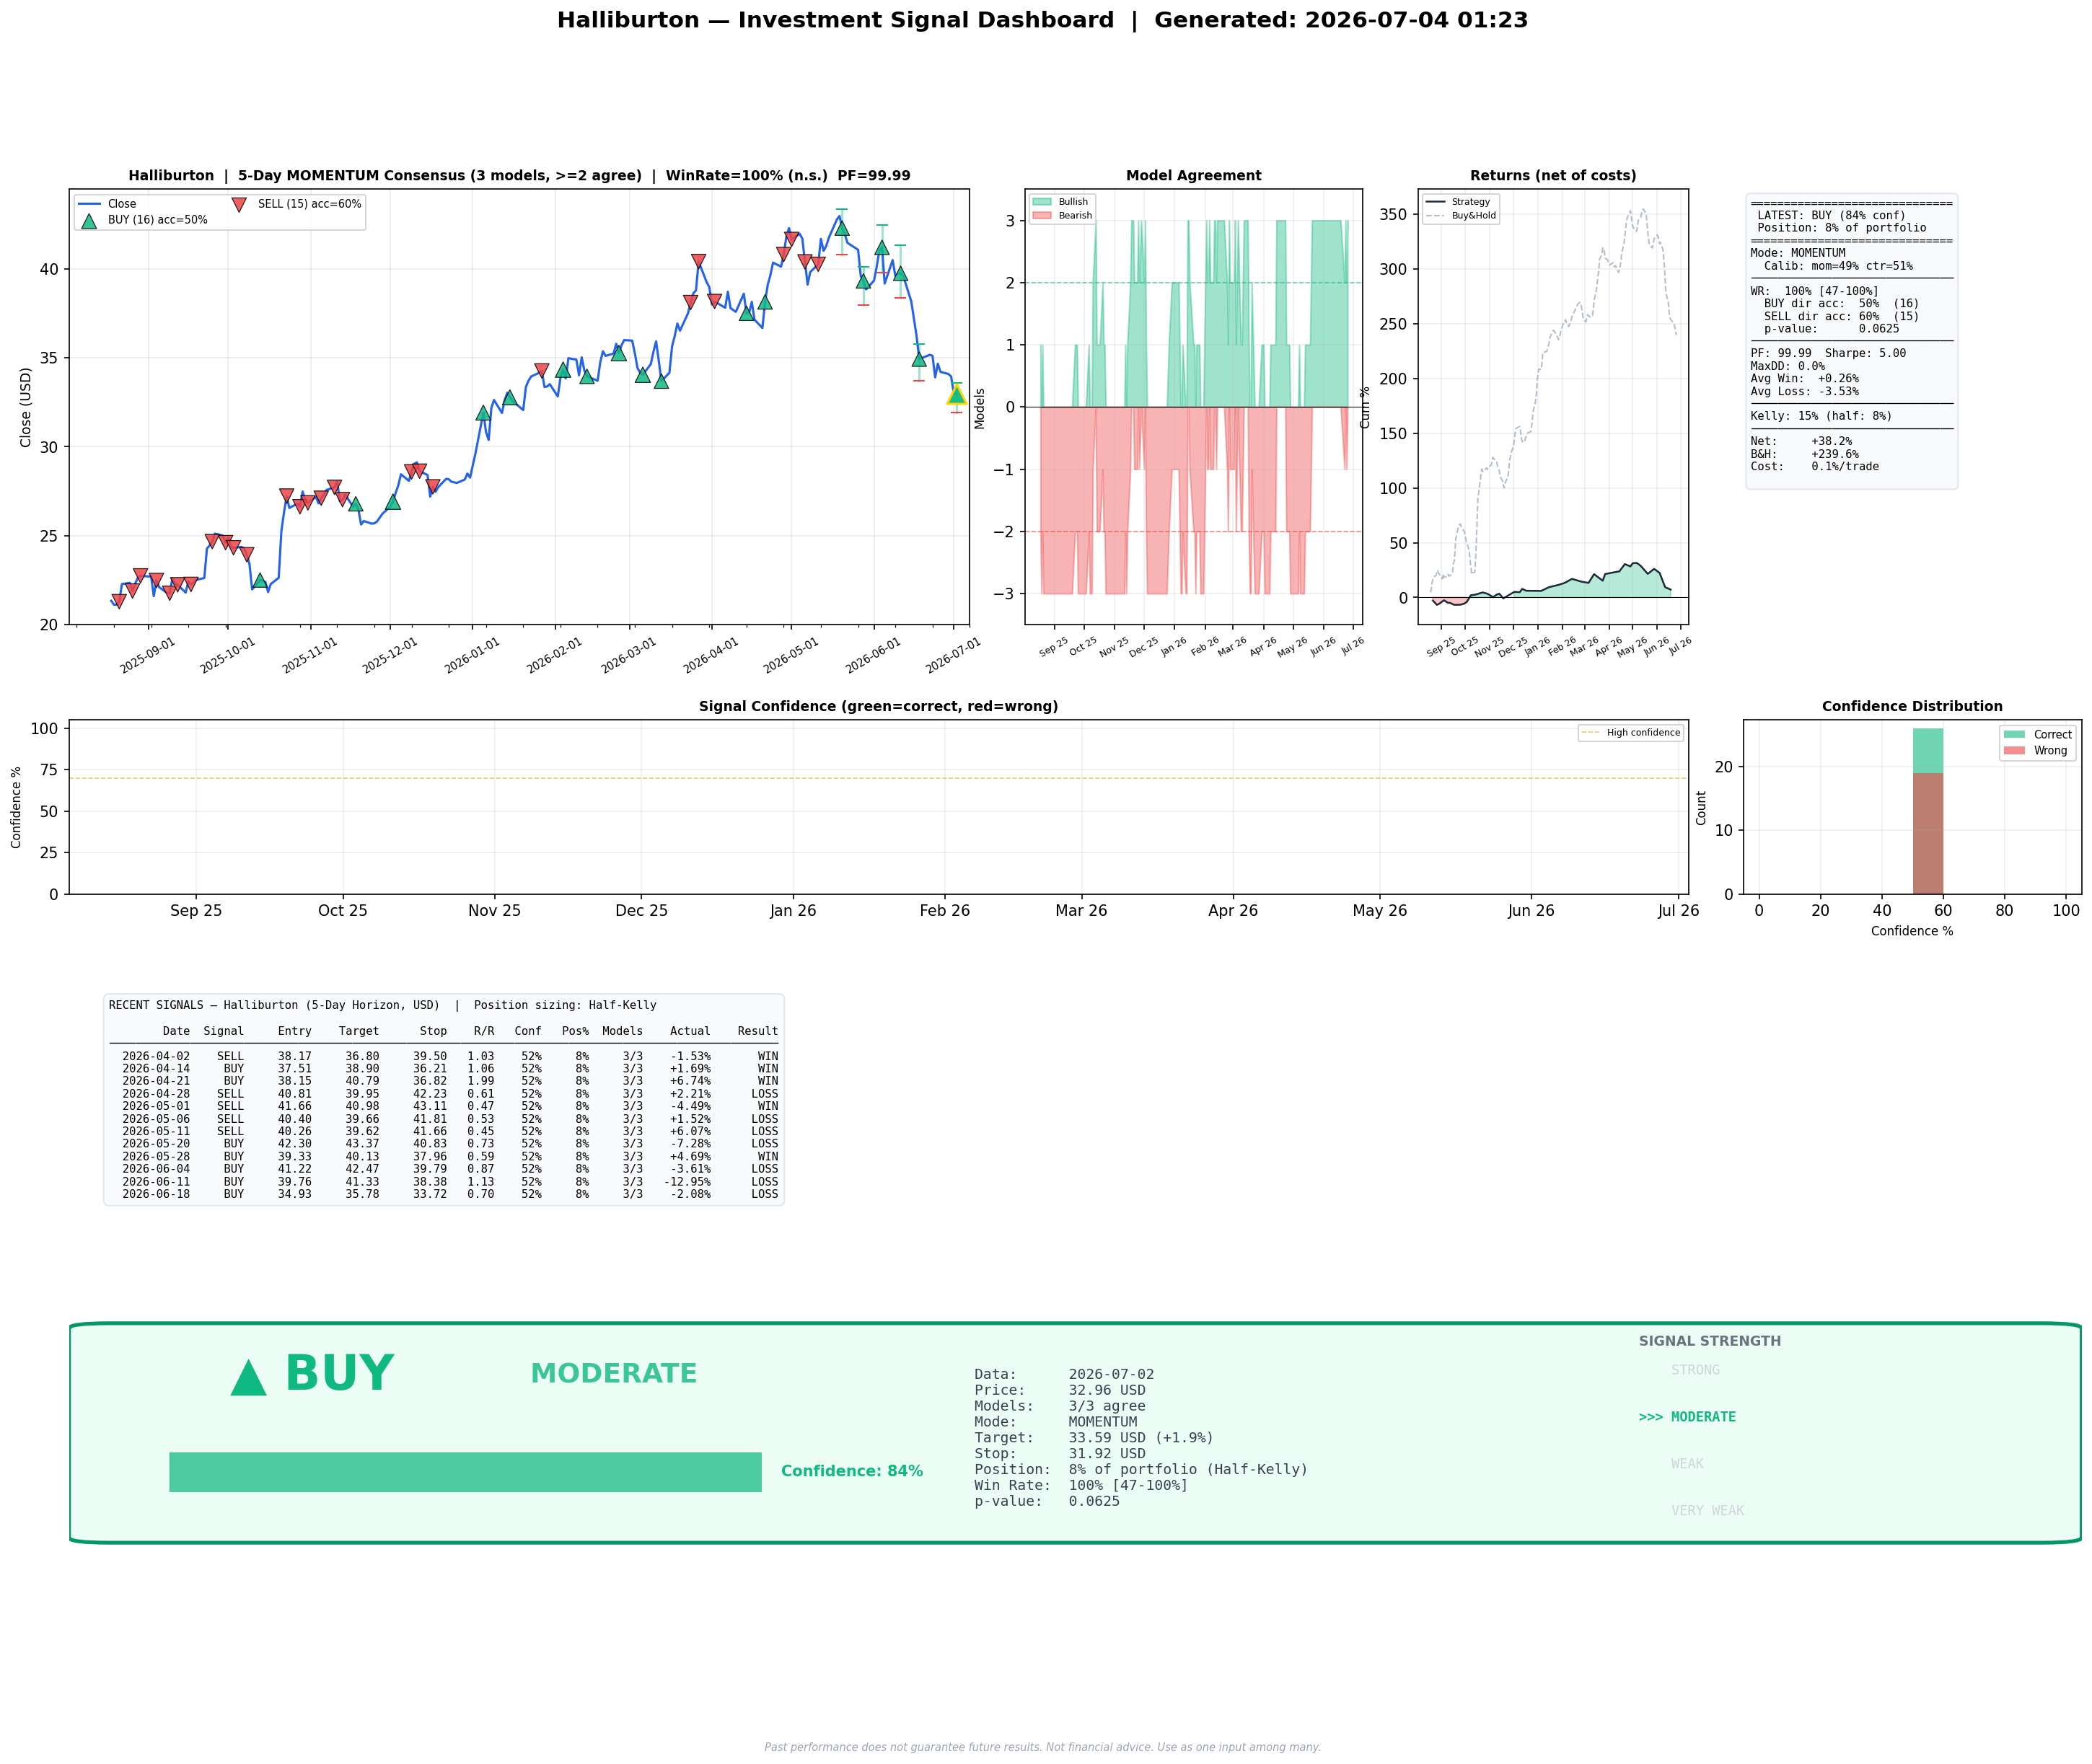
| HAL | BUY | WEAK | 66% | 60% | 34.43 | 33.02 | 100% | 5.00 | momentum | Chart |
| LNT | BUY | MODERATE | 83% | 108% | 77.91 | 75.70 | 20% | -0.95 | contrarian | Chart |
| NEM | BUY | MODERATE | 84% | 111% | 100.96 | 91.22 | 83% | 2.45 | momentum | Chart |
| NTRS | BUY | MODERATE | 84% | 111% | 175.89 | 169.61 | 100% | — | 0.00 | Chart |
| NUE | BUY | WEAK | 69% | 69% | 243.22 | 231.54 | 75% | 3.24 | momentum | Chart |
| ROST | BUY | MODERATE | 84% | 111% | 219.81 | 206.00 | 100% | — | 0.00 | Chart |
| SBUX | BUY | MODERATE | 84% | 111% | 107.14 | 101.98 | 75% | 2.96 | momentum | Chart |
| STLD | BUY | WEAK | 69% | 69% | 248.49 | 235.23 | 100% | 5.00 | momentum | Chart |
| VTR | BUY | WEAK | 64% | 55% | 89.43 | 86.26 | 100% | — | 0.00 | Chart |
| Ticker | Signal | Strength | Confidence | Position | Target | Stop | Accuracy | Sharpe | Mode | Chart |
|---|---|---|---|---|---|---|---|---|---|---|
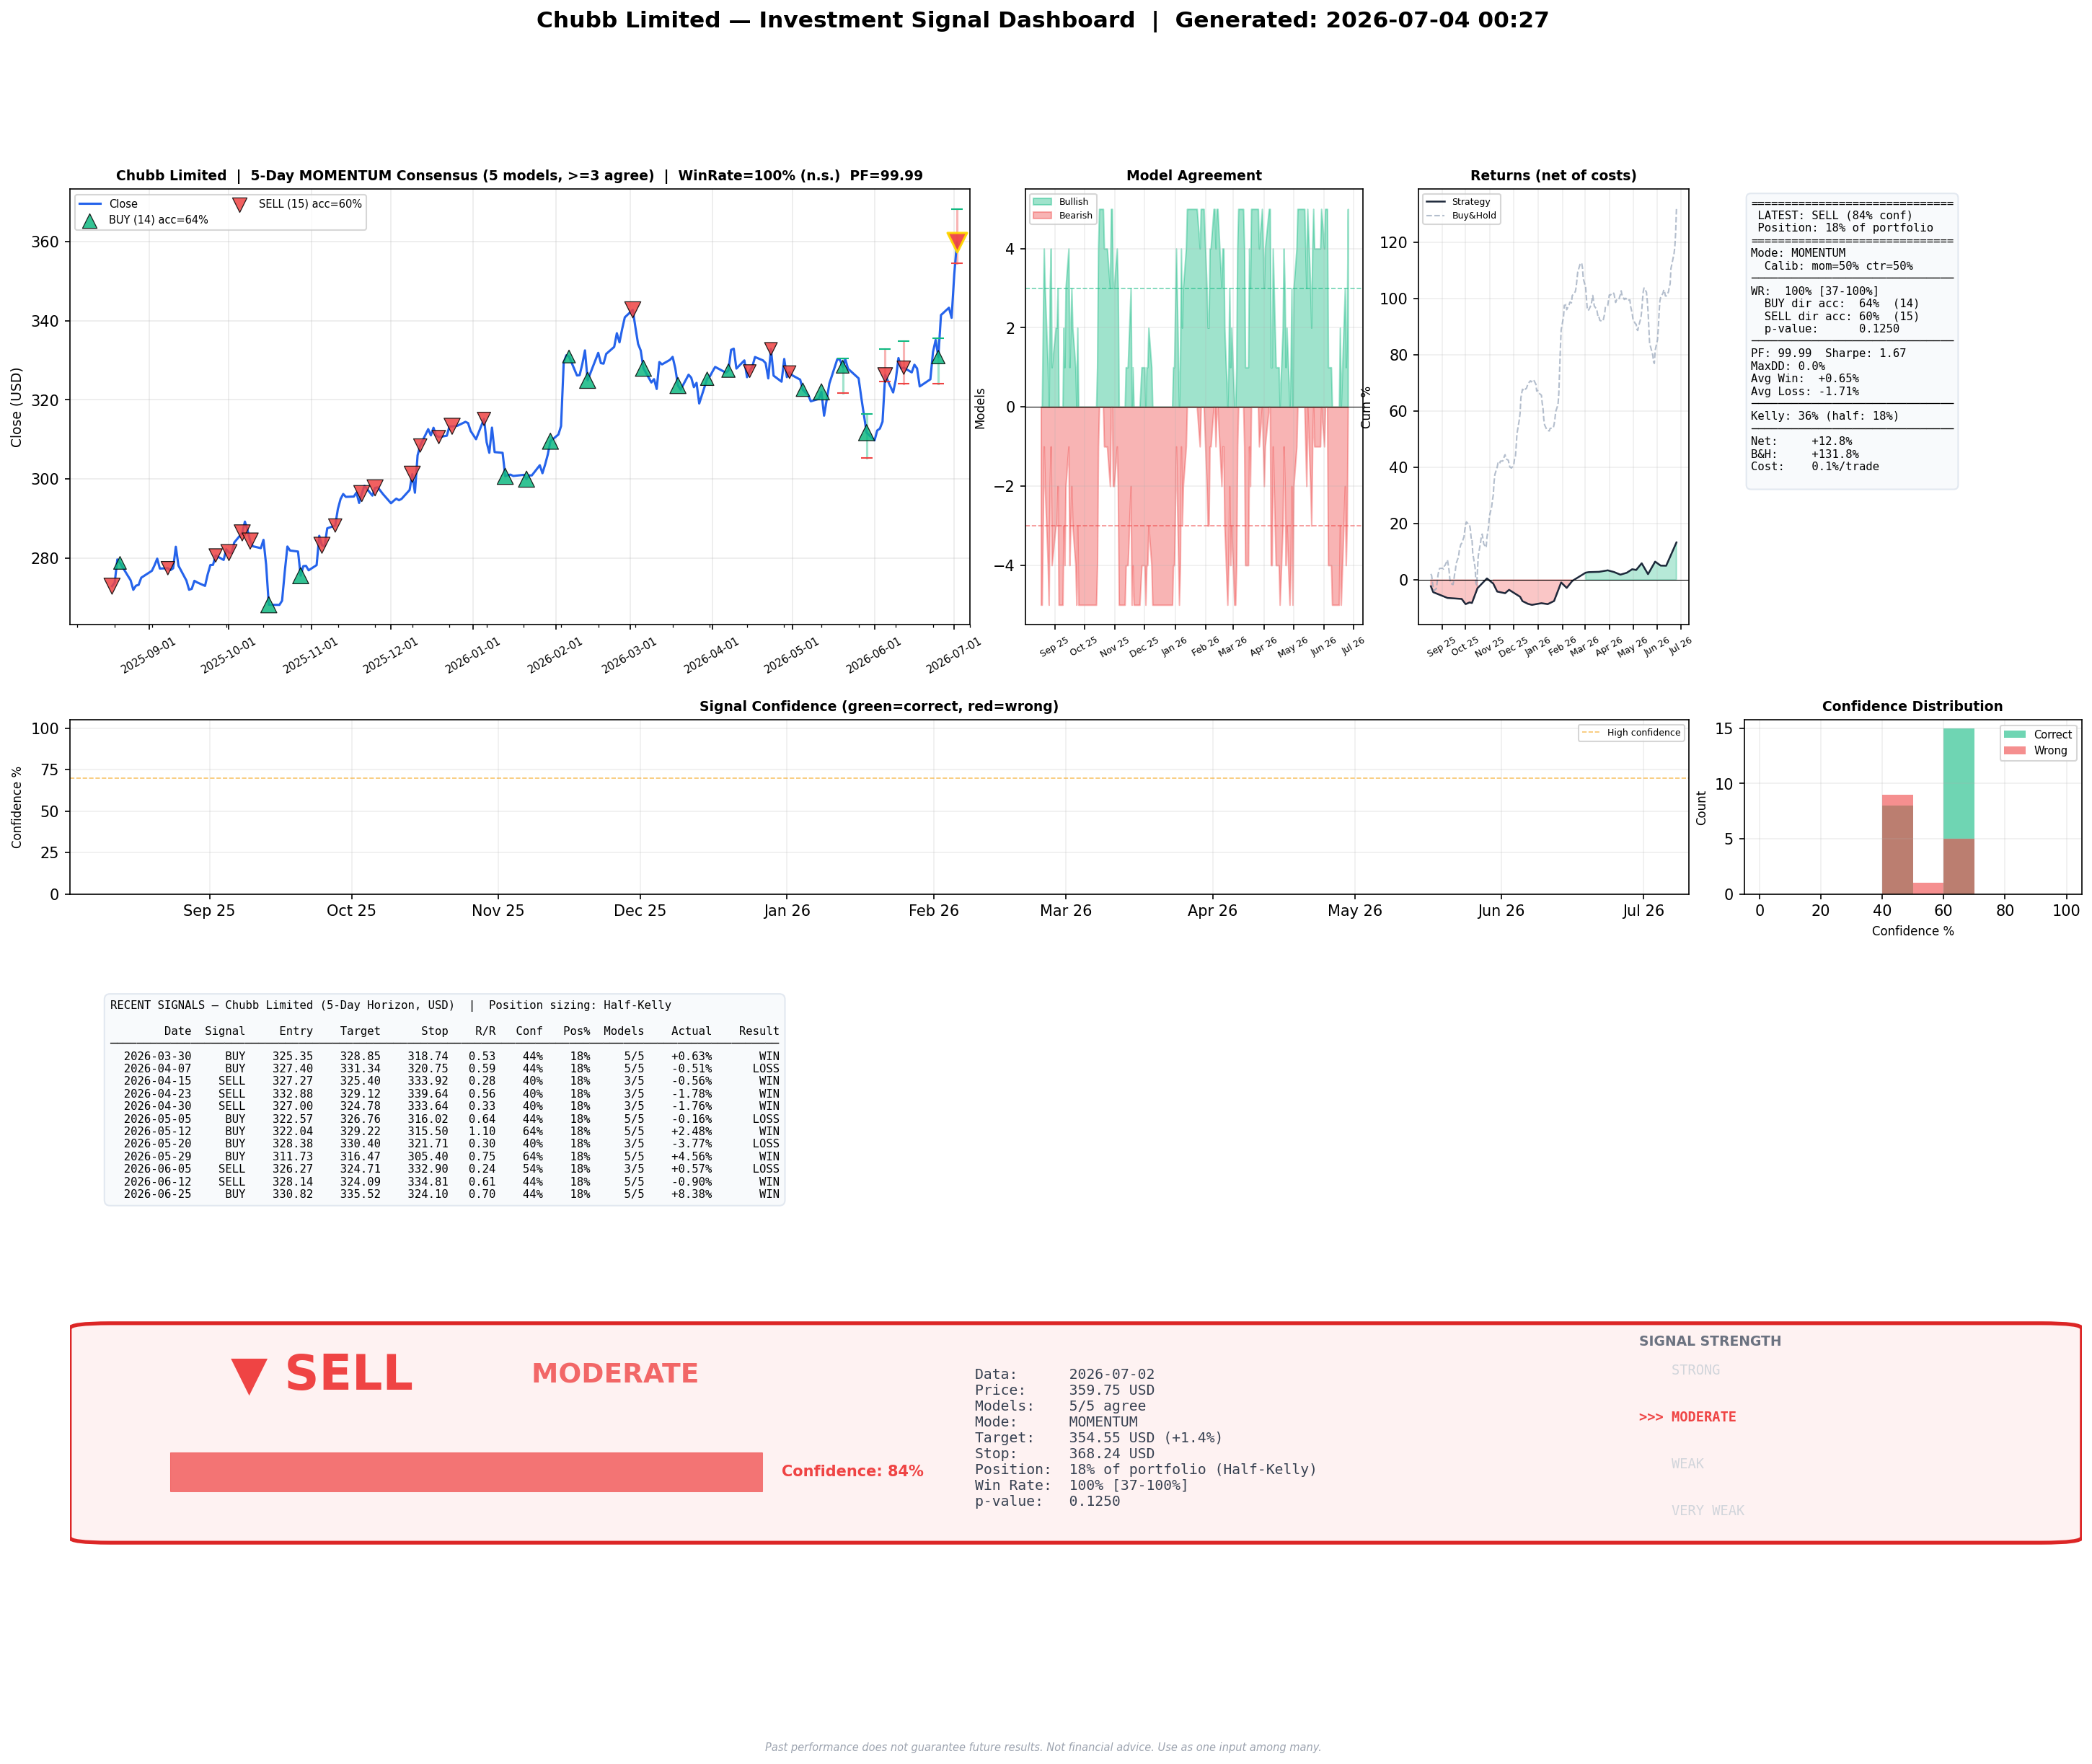
| CB | SELL | WEAK | 69% | 69% | 336.64 | 348.94 | 100% | 2.96 | momentum | Chart |
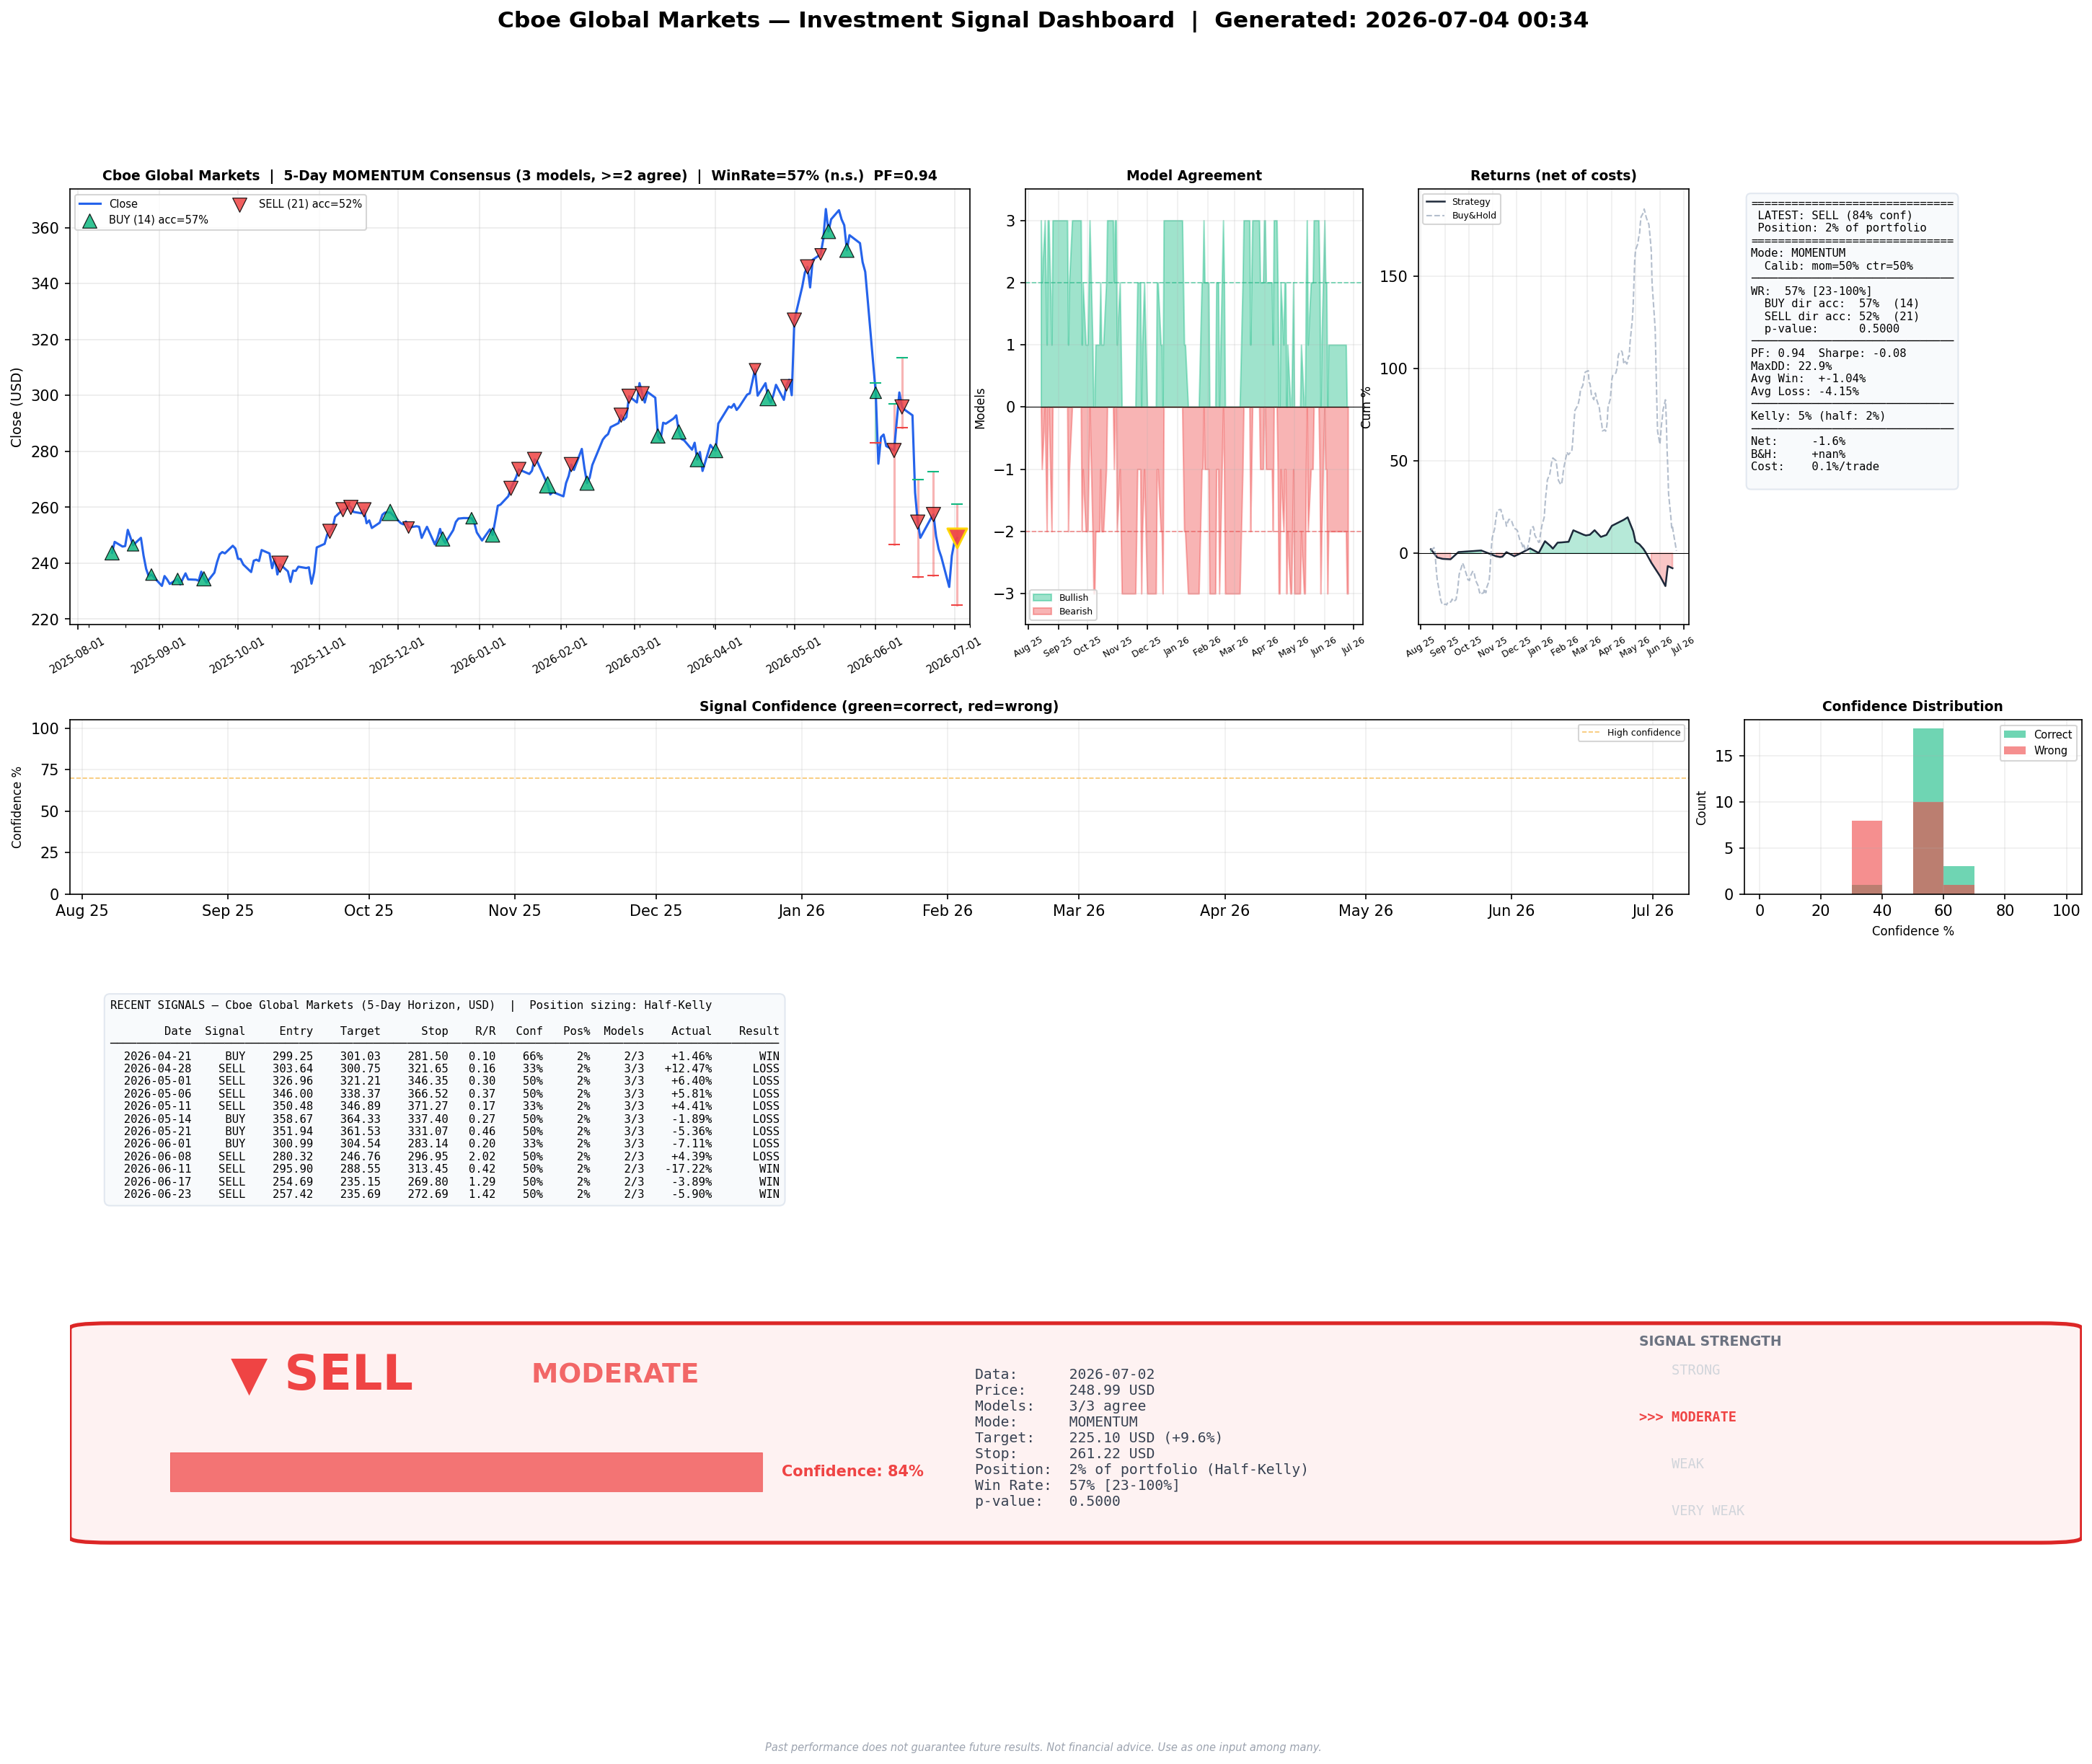
| CBOE | SELL | MODERATE | 84% | 111% | 227.12 | 256.57 | 80% | -0.01 | momentum | Chart |
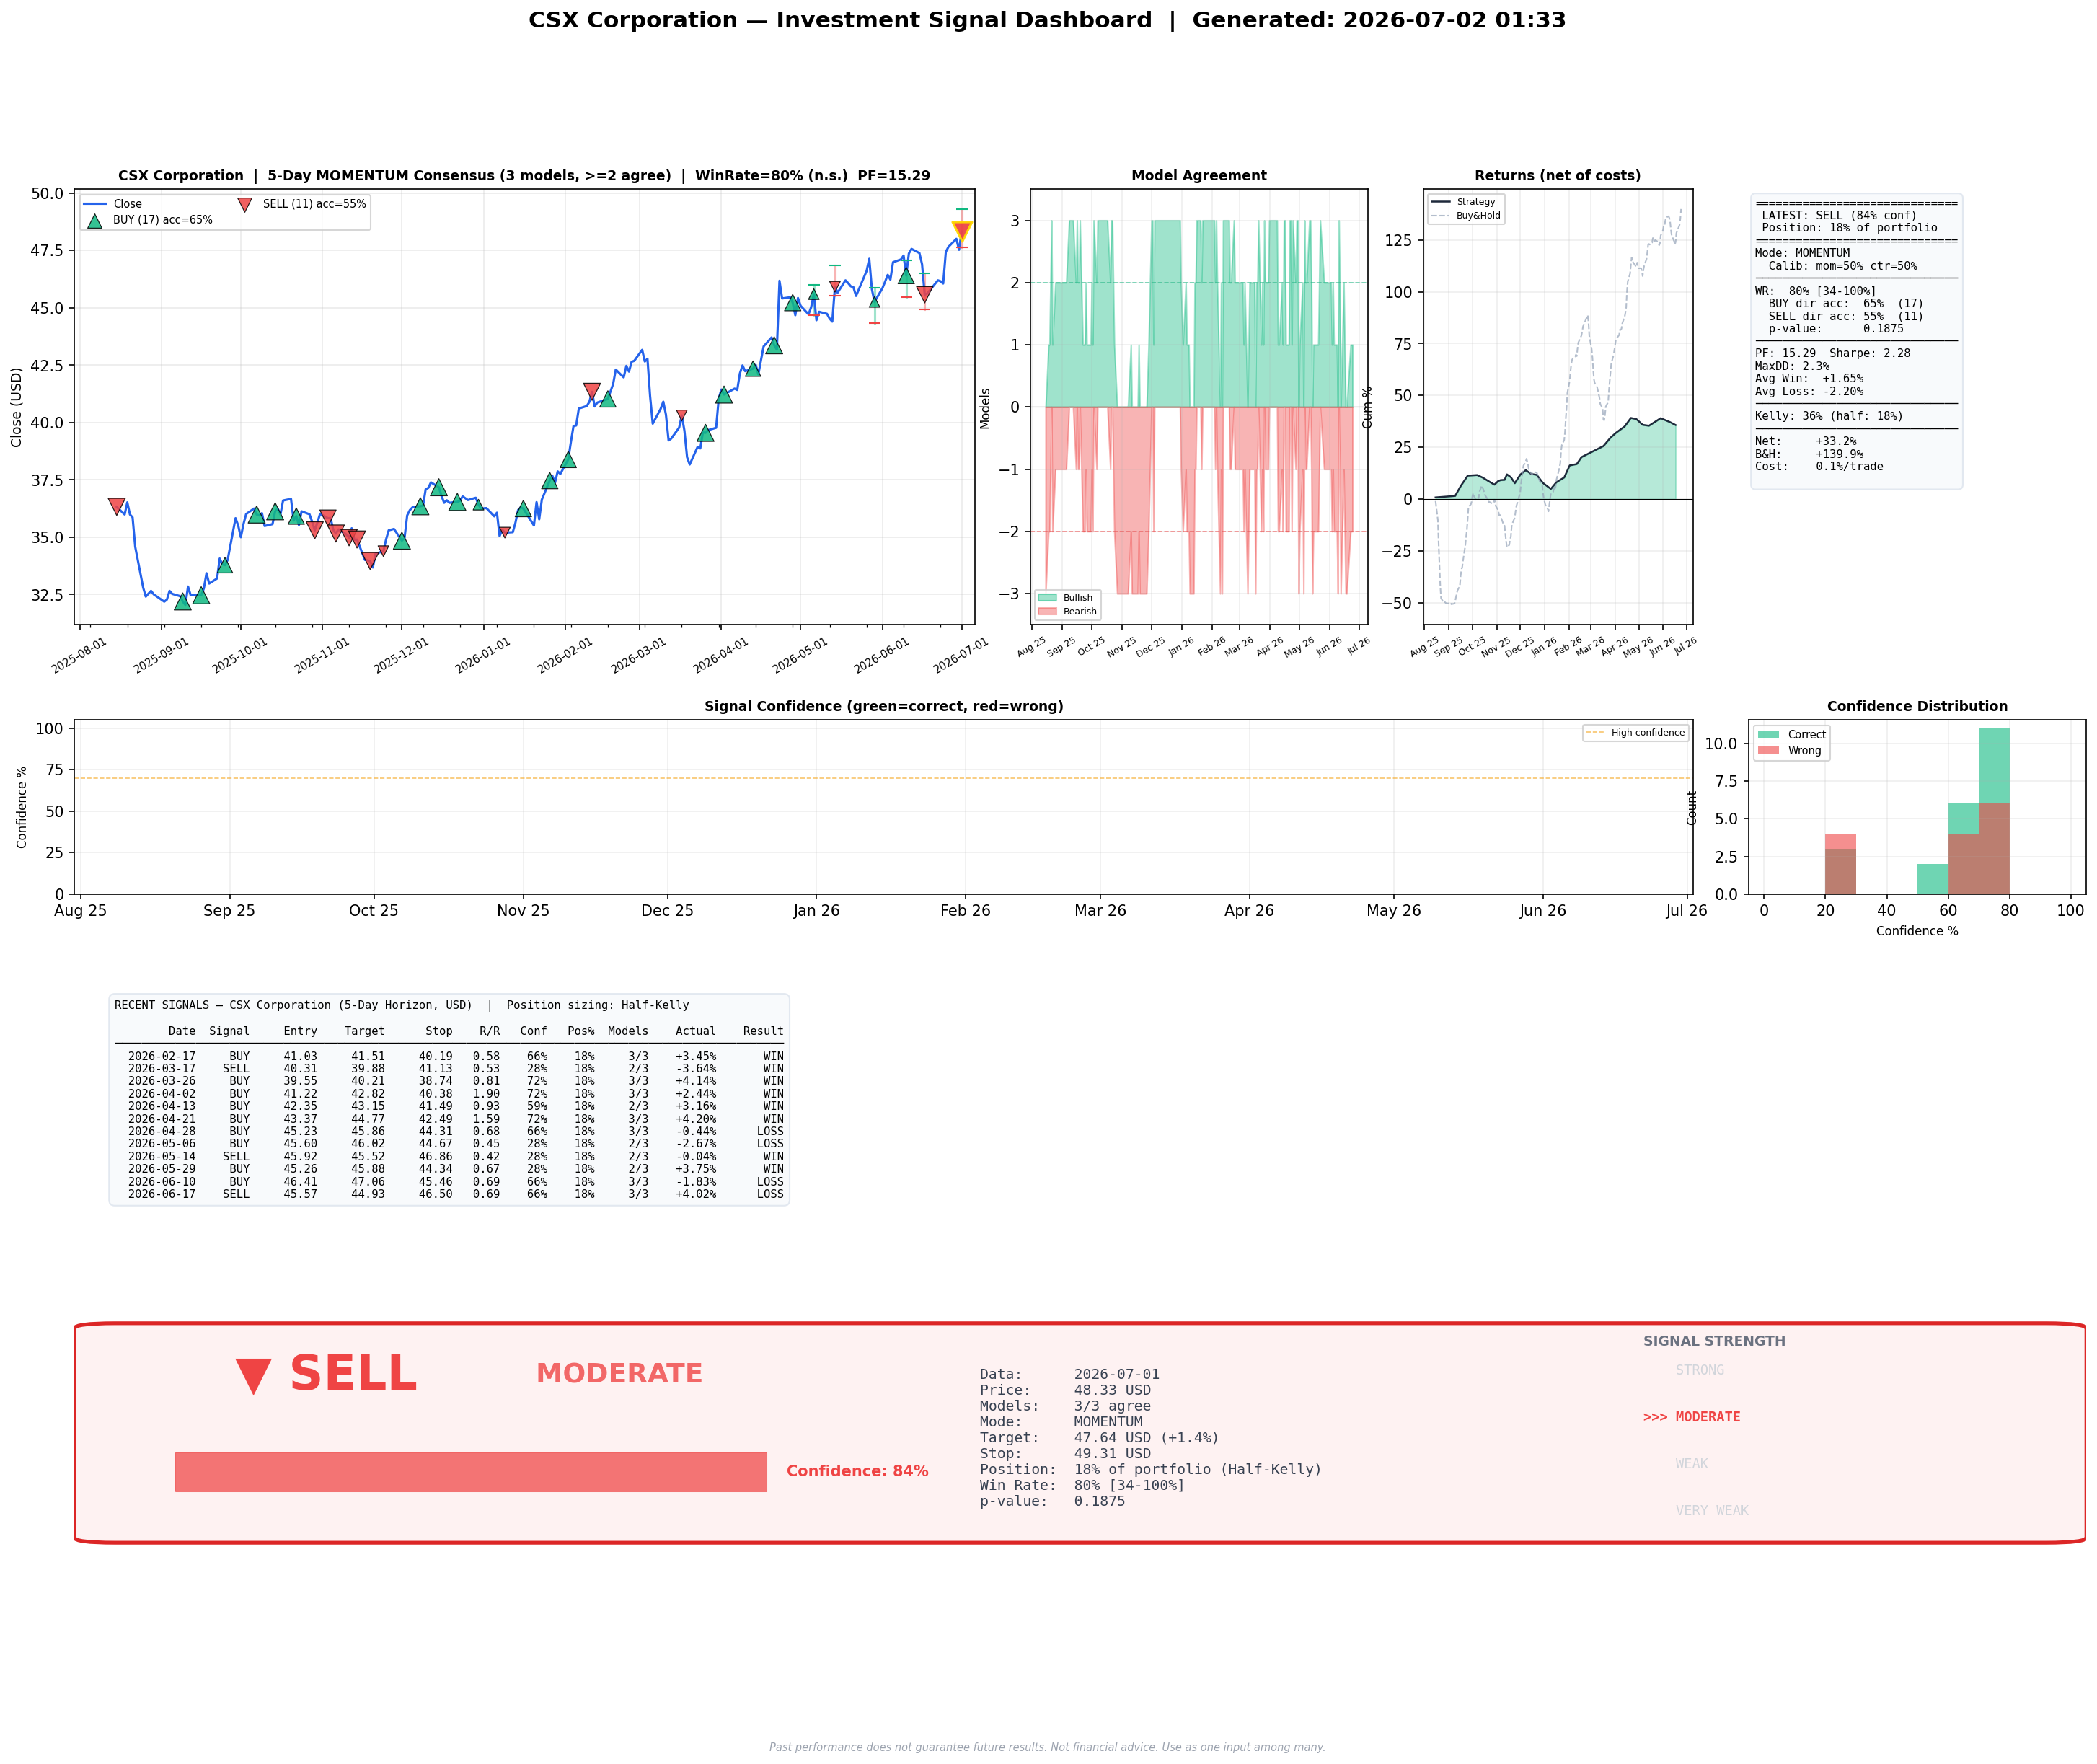
| CSX | SELL | MODERATE | 84% | 111% | 46.95 | 48.62 | 33% | 1.08 | momentum | Chart |
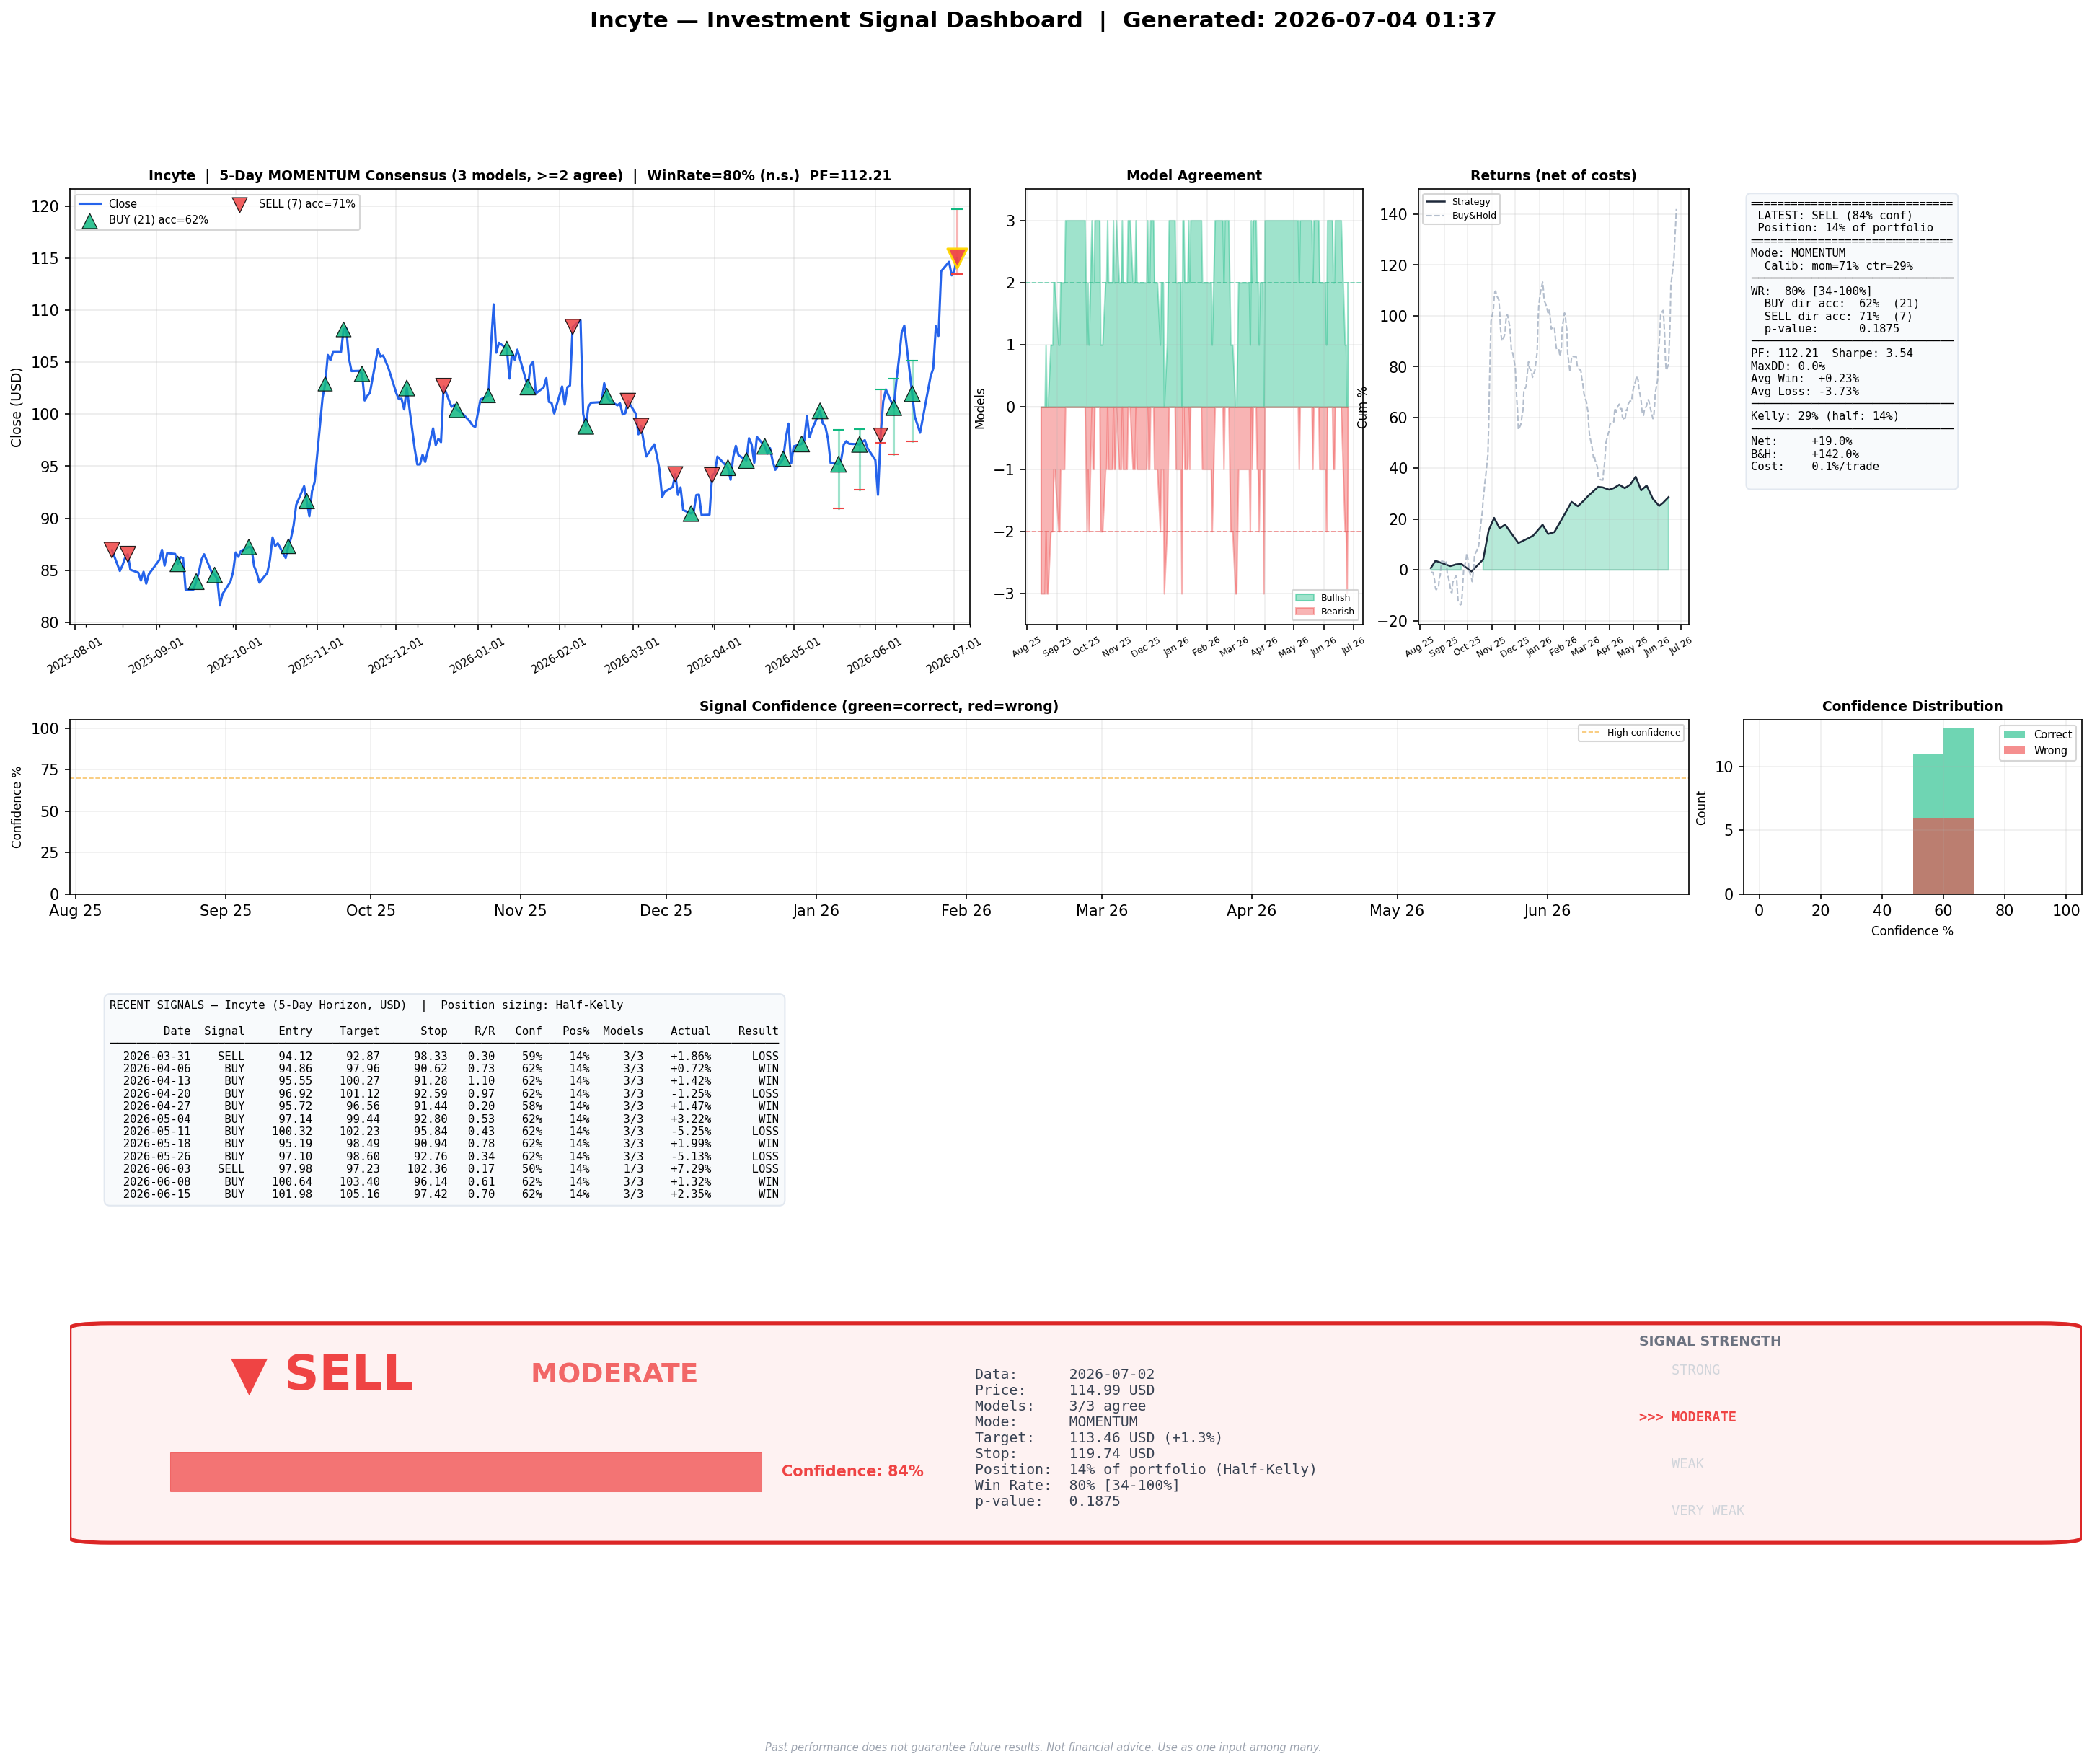
| INCY | SELL | WEAK | 69% | 69% | 111.70 | 119.21 | 100% | 4.14 | momentum | Chart |
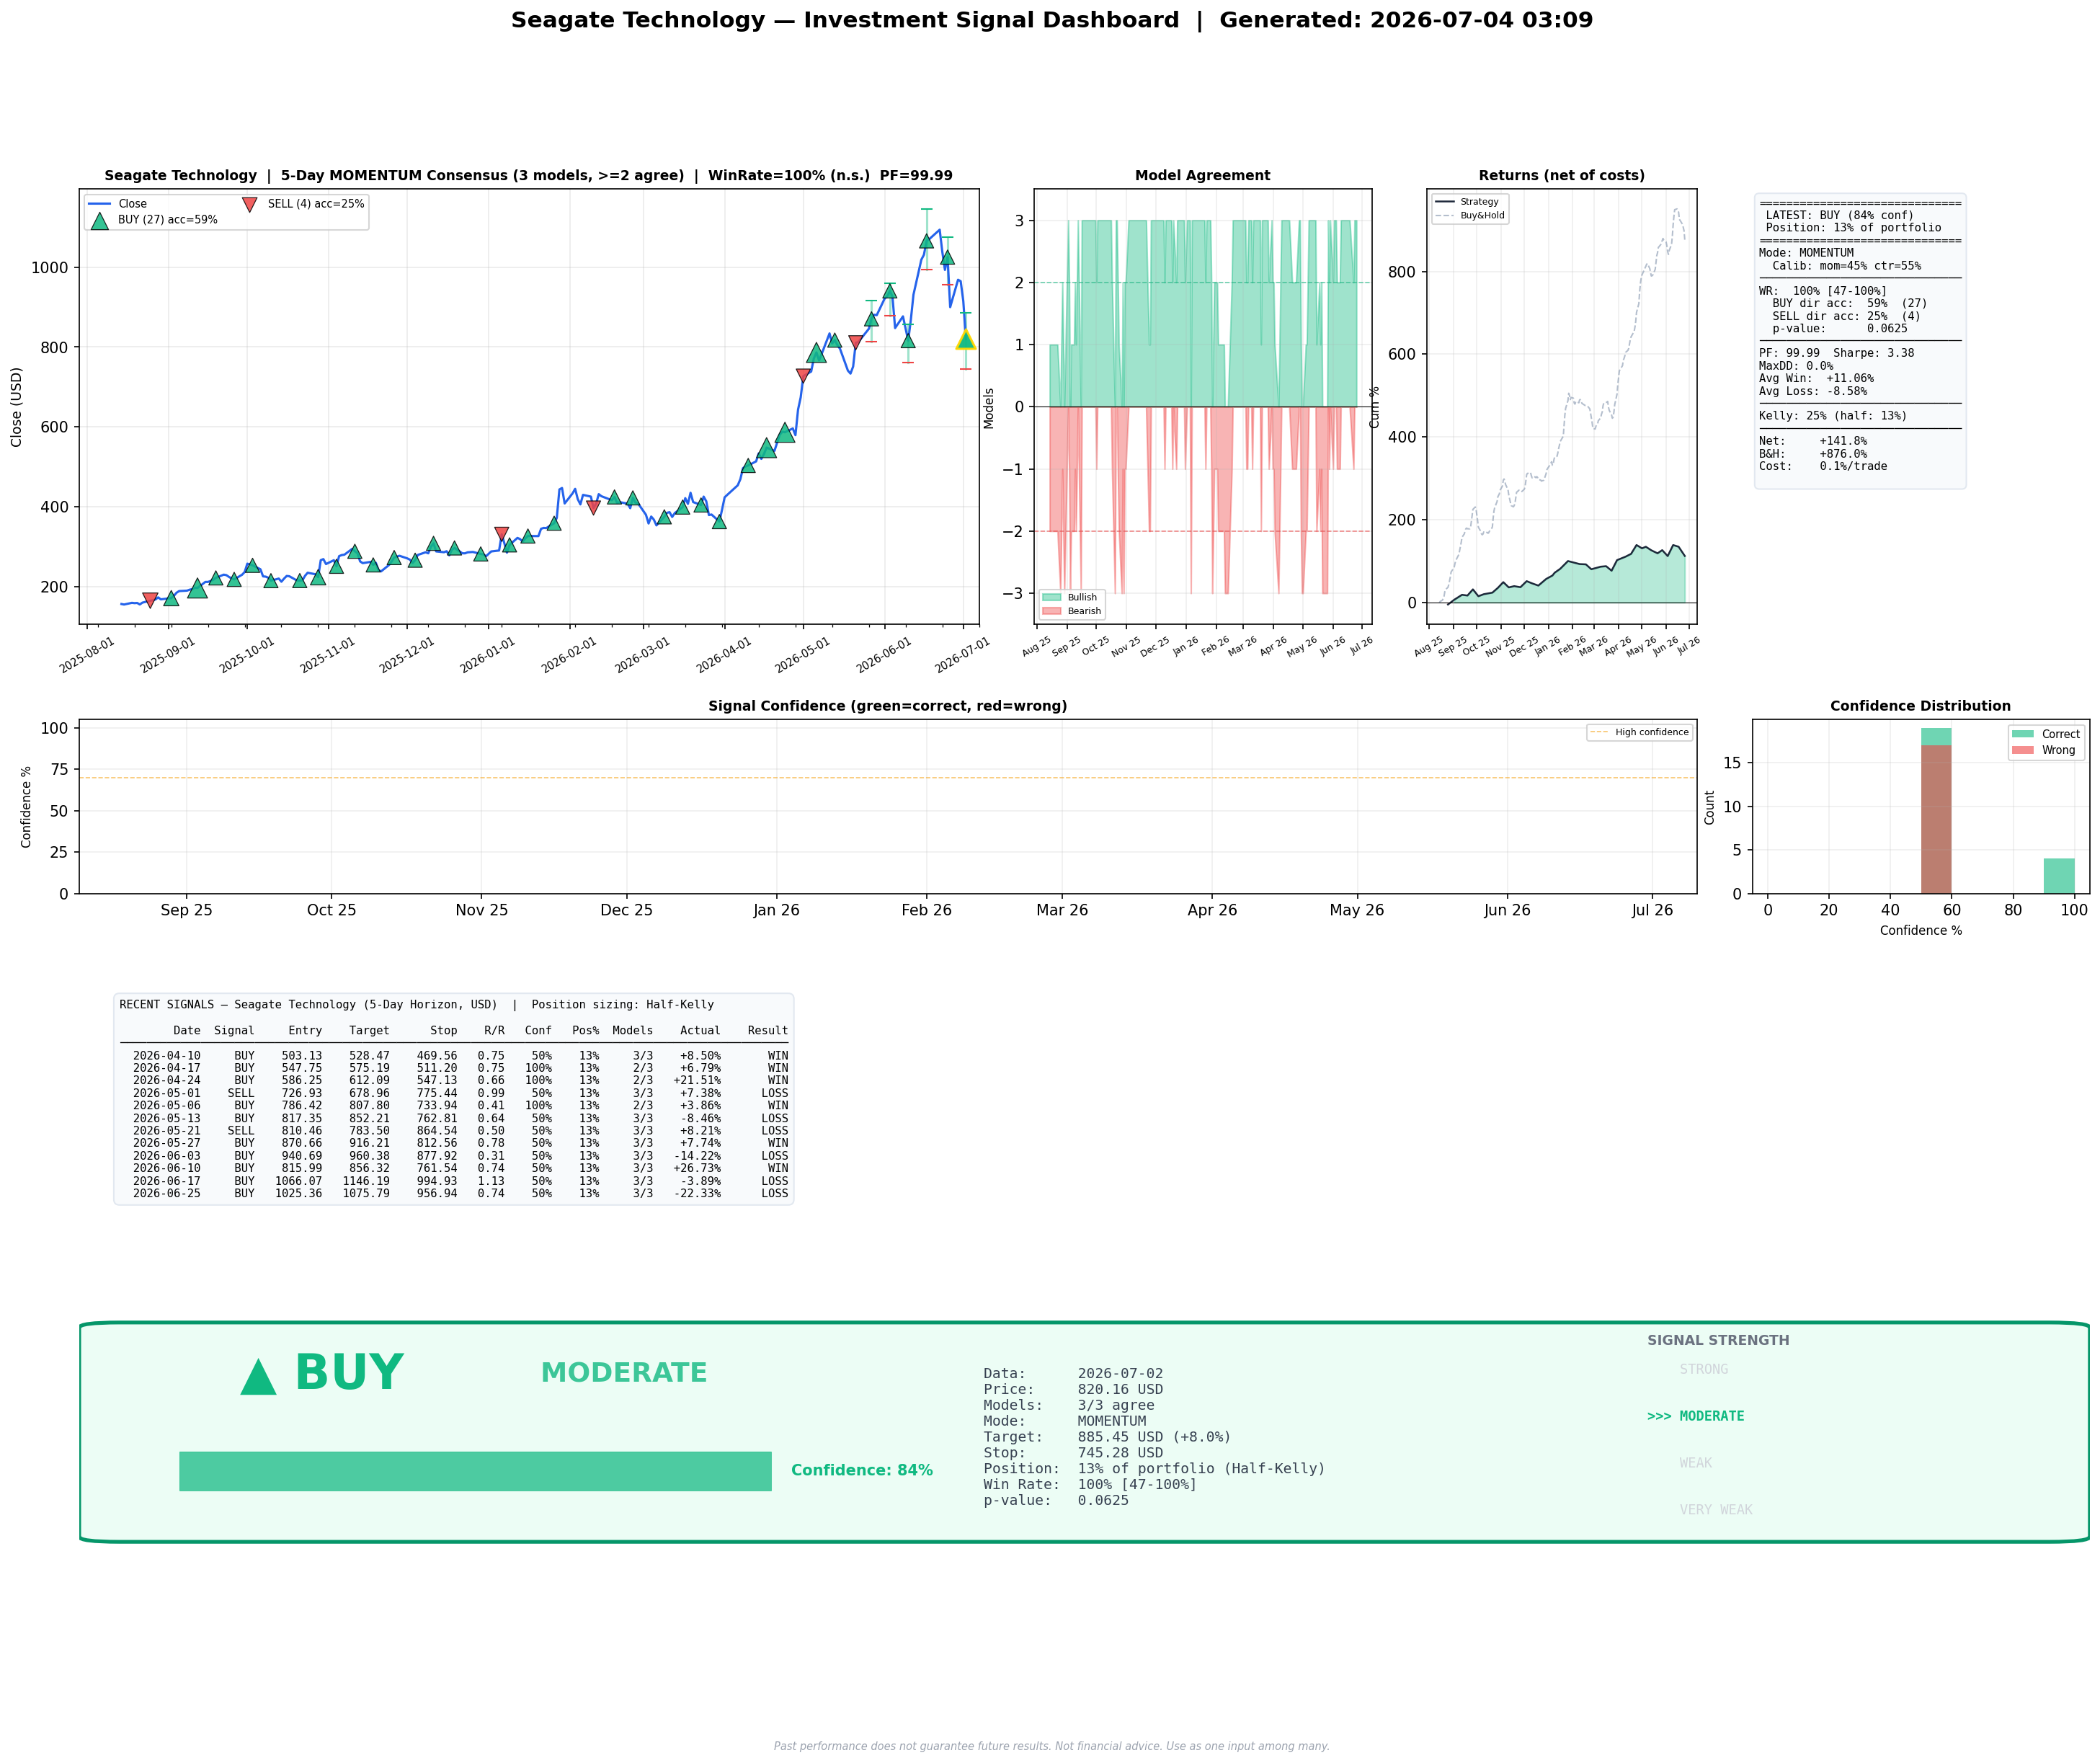
| STX | SELL | MODERATE | 84% | 111% | 855.49 | 976.78 | 80% | 2.68 | contrarian | Chart |
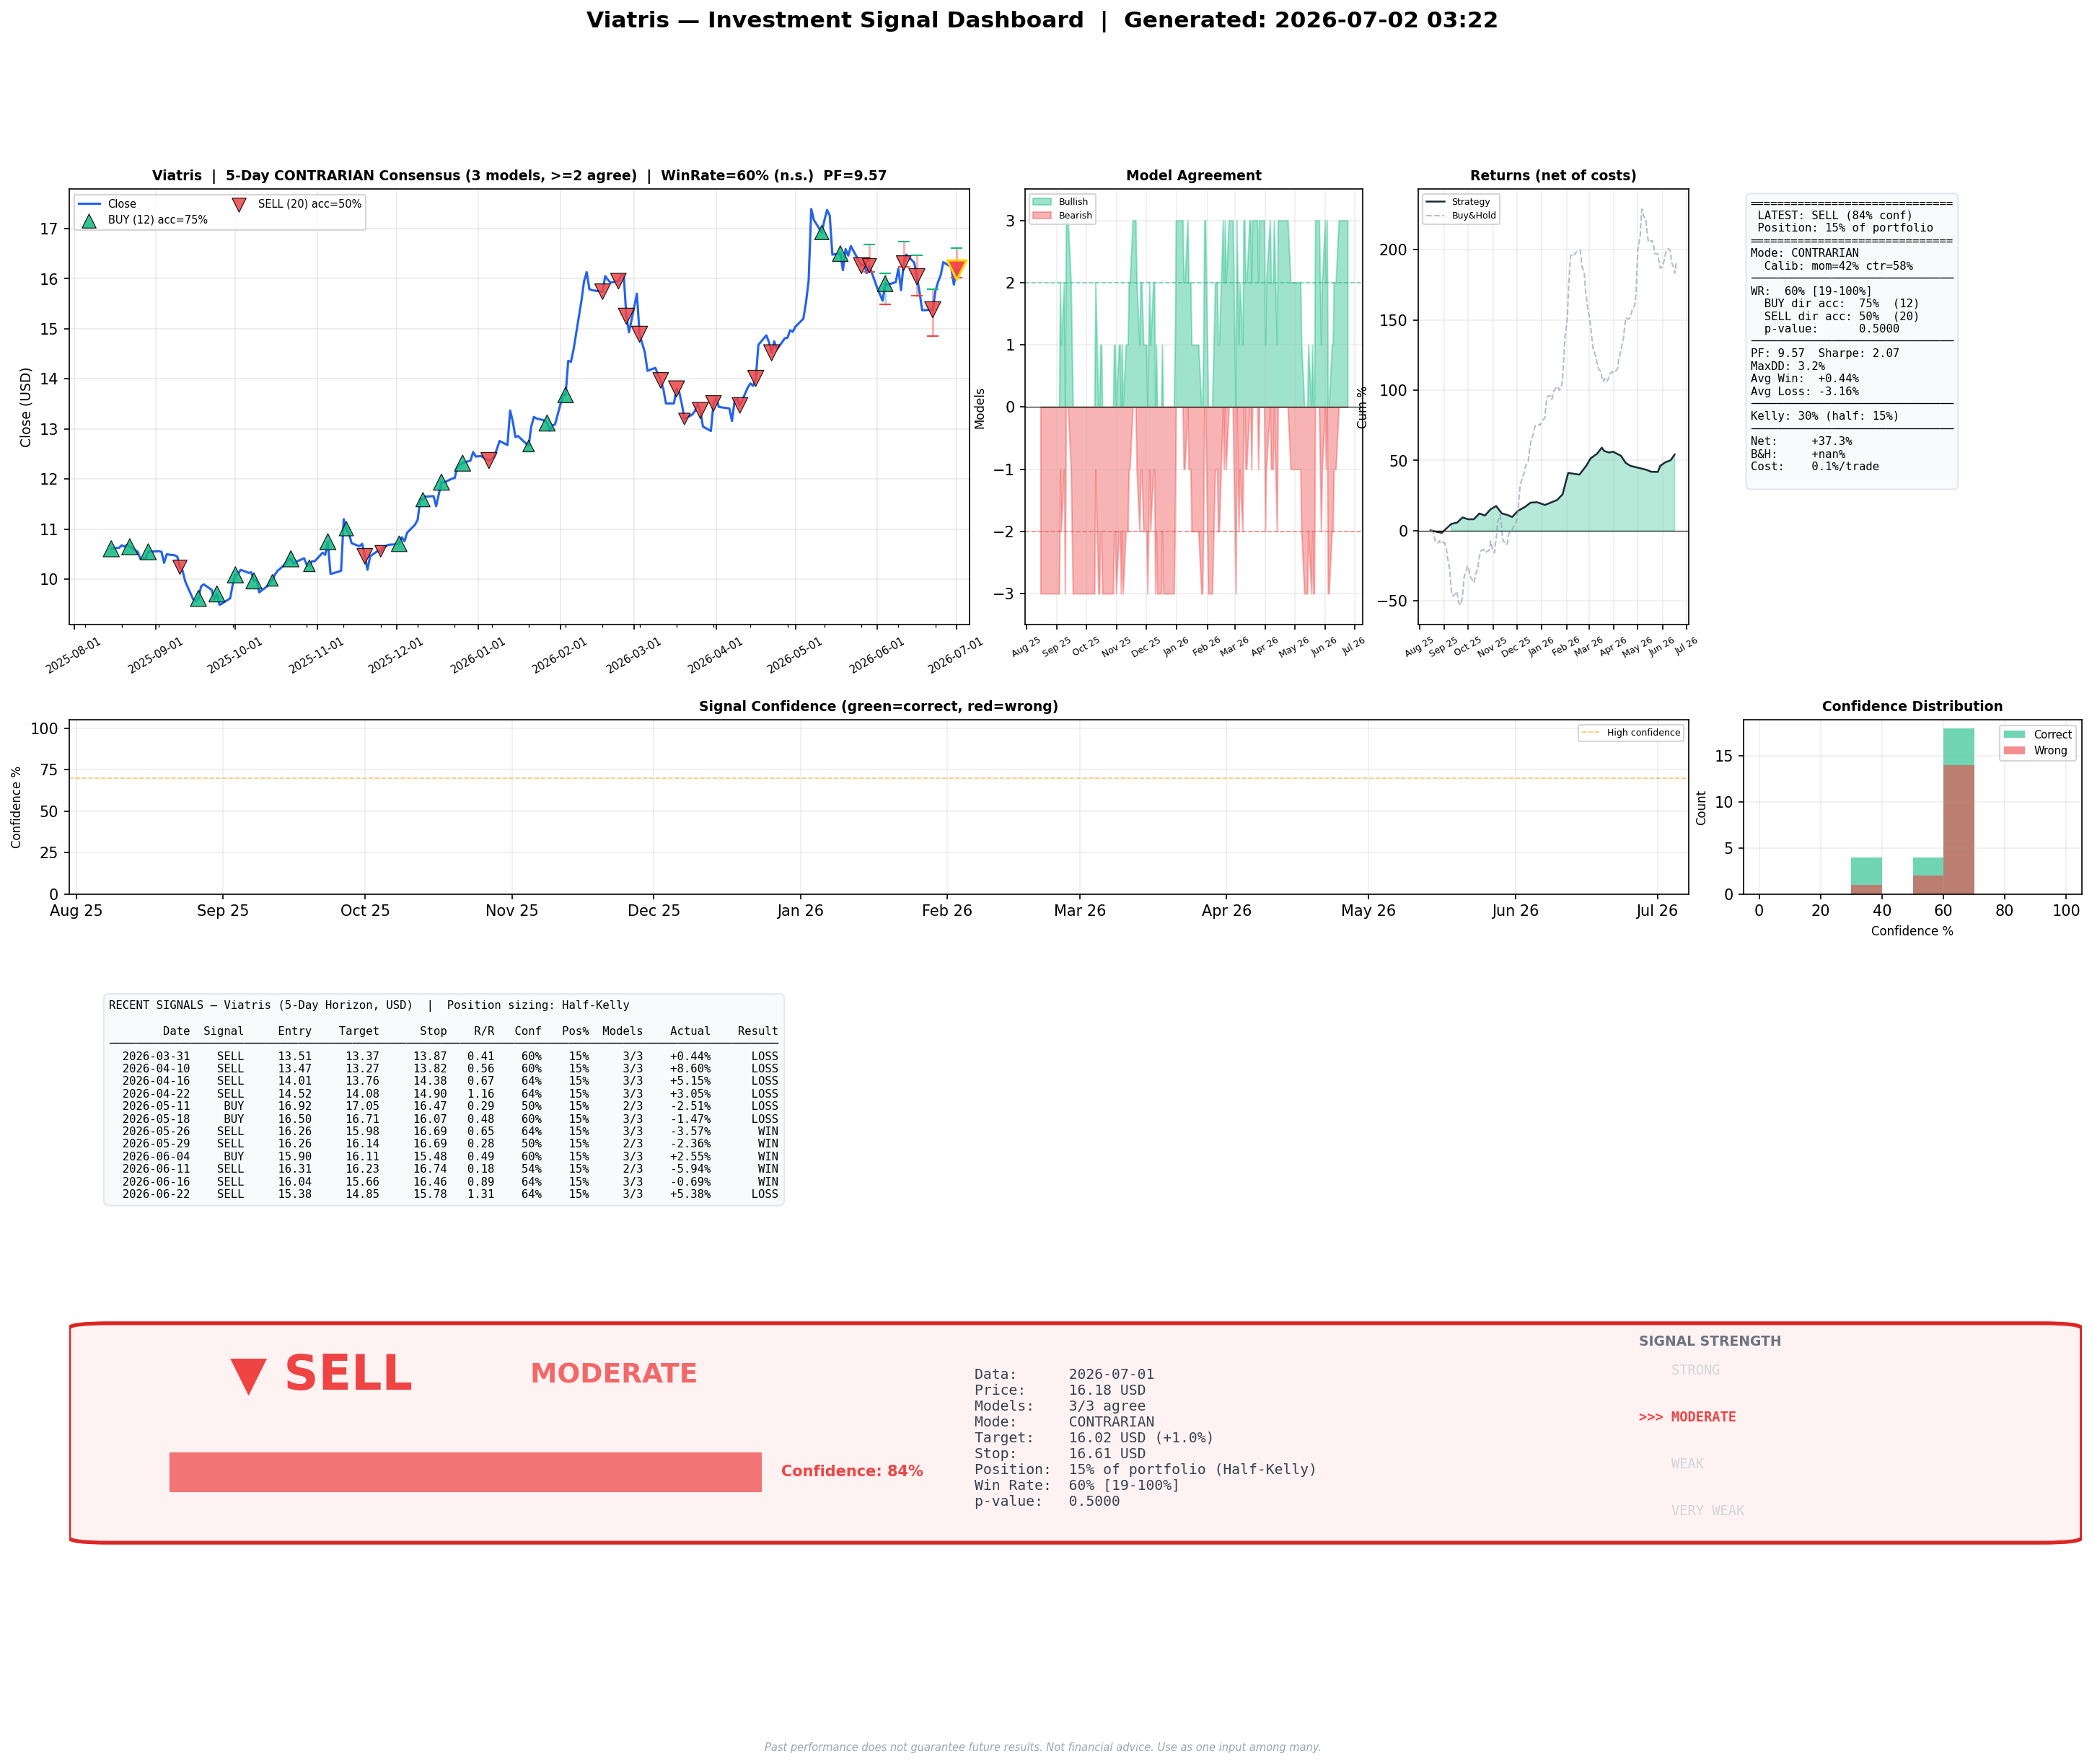
| VTRS | SELL | WEAK | 69% | 69% | 15.95 | 16.77 | 83% | 3.42 | momentum | Chart |
DAILY TRADING SIGNALS — 2026-06-27 04:39
===========================================================================

    Ticker  Signal    Strength   Conf  Position      Target        Stop  Accuracy   Sharpe        Mode
---------------------------------------------------------------------------------------------------------
       ADI     BUY        WEAK    69%      69%     394.15     363.86       67%    1.06    momentum
      AKAM     BUY        WEAK    69%      69%     114.71     107.83       75%    2.91    momentum
       AME     BUY    MODERATE    84%     111%     239.95     231.51       67%    0.93  contrarian
      CASY    HOLD           -     0%         —           —           —      100%    5.00    momentum
       CAT     BUY        WEAK    69%      69%    1013.05     946.39        0%    0.00    momentum
        CB    SELL        WEAK    69%      69%     336.64     348.94      100%    2.96    momentum
      CBOE    SELL    MODERATE    84%     111%     227.12     256.57       80%   -0.01    momentum
       CMI     BUY    MODERATE    84%     111%     702.34     652.15      100%    5.00    momentum
      CSCO     BUY        WEAK    69%      69%     115.17     109.19      100%    2.62    momentum
       CSX    SELL    MODERATE    84%     111%      46.95      48.62       33%    1.08    momentum
       DAL    HOLD           -     0%         —           —           —      100%    3.15  contrarian
      FANG     BUY        WEAK    63%      52%     180.58     173.34       75%    2.48    momentum
       HAL     BUY        WEAK    66%      60%      34.43      33.02      100%    5.00    momentum
      INCY    SELL        WEAK    69%      69%     111.70     119.21      100%    4.14    momentum
       LNT     BUY    MODERATE    83%     108%      77.91      75.70       20%   -0.95  contrarian
       NEM     BUY    MODERATE    84%     111%     100.96      91.22       83%    2.45    momentum
      NTRS     BUY    MODERATE    84%     111%     175.89     169.61      100%    0.00    momentum
       NUE     BUY        WEAK    69%      69%     243.22     231.54       75%    3.24    momentum
      ROST     BUY    MODERATE    84%     111%     219.81     206.00      100%    0.00    momentum
      SBUX     BUY    MODERATE    84%     111%     107.14     101.98       75%    2.96    momentum
      STLD     BUY        WEAK    69%      69%     248.49     235.23      100%    5.00    momentum
       STX    SELL    MODERATE    84%     111%     855.49     976.78       80%    2.68  contrarian
       VTR     BUY        WEAK    64%      55%      89.43      86.26      100%    0.00    momentum
      VTRS    SELL        WEAK    69%      69%      15.95      16.77       83%    3.42    momentum
       WAB    HOLD           -     0%         —           —           —      100%    0.00    momentum

===========================================================================

BUY SIGNALS:
         AME    MODERATE  (84% confidence)
         CMI    MODERATE  (84% confidence)
         NEM    MODERATE  (84% confidence)
        NTRS    MODERATE  (84% confidence)
        ROST    MODERATE  (84% confidence)
        SBUX    MODERATE  (84% confidence)
         LNT    MODERATE  (83% confidence)
         ADI        WEAK  (69% confidence)
        AKAM        WEAK  (69% confidence)
         CAT        WEAK  (69% confidence)
        CSCO        WEAK  (69% confidence)
         NUE        WEAK  (69% confidence)
        STLD        WEAK  (69% confidence)
         HAL        WEAK  (66% confidence)
         VTR        WEAK  (64% confidence)
        FANG        WEAK  (63% confidence)

SELL SIGNALS:
        CBOE    MODERATE  (84% confidence)
         CSX    MODERATE  (84% confidence)
         STX    MODERATE  (84% confidence)
          CB        WEAK  (69% confidence)
        INCY        WEAK  (69% confidence)
        VTRS        WEAK  (69% confidence)

HOLD: CASY, DAL, WAB

---------------------------------------------------------------------------
Past performance does not guarantee future results. Not financial advice.
Generated: 2026-06-27 04:39
Past performance does not guarantee future results. Not financial advice.